Statistics
This section provides a range of statistics about East Dunbartonshire, from a variety of sources.
On this page you will find information on:
- Summary Statistics
- Population
- Population Estimates
- Population Projections
- Life Expectancy
- Ethnicity
- National Identity
- Country of Birth
- Marital Status
- Language
- Religion
- Migration
- Households Estimates
- Local Economy
- Household Projections
- Health
- Further Information
Introduction
The East Dunbartonshire Area Profile provides an overview of the population and its detailed characteristics. The information is provided for Scotland and East Dunbartonshire. The COVID-19 pandemic has affected some statistics and data sources, any affected data has been highlighted throughout this document. The impact of the COVID-19 pandemic also forced a delay to Scotland’s Census. The Census was due to take place in March 2021 but took place on 20 March 2022. Initial data was released in September 2023 and May 2024 with further releases due throughout 2024. Census data can be found on the Scotland's Census website [opens in a new window].
The data used in this document has been prepared from a variety of sources including the 2011 Census, 2022 Census (where available), NOMIS (official labour market statistics website) and Statistics.gov.scot and has used the most up to date data available at the time of writing. For some topic areas, the 2011 Census is the only source of data and therefore remains the most up to date data available at this time. Due to rounding, numbers presented throughout this document may not add up precisely to the totals indicated and percentages may not reflect the absolute figures for the same reason
Overall, East Dunbartonshire continues to compare favourably to Scotland and other local authority areas with a high percentage of home ownership, car ownership, low unemployment and a high percentage of economically active residents. In 2021, East Dunbartonshire was in the top five of the money.co.uk Work Life Balance Index. The online site analysed Office for National Statistics data to uncover where in Britain was best situated to achieve a good work life balance.
Although East Dunbartonshire, as a whole, is less deprived than other authorities in Scotland, there are specific areas within East Dunbartonshire that fall below the Scottish average. Hillhead remains the most deprived area in East Dunbartonshire, but it should be noted that Scottish Index of Multiple Deprivation ranks in the area have improved.
Summary Statistics
| Overview | East Dunbartonshire | Scotland | ||
|---|---|---|---|---|
| Population | Population rounded (Census 2022) | 109,000 | 5,436,600 | |
|
Economy |
Economically Active | 76.3% | 77.4% | |
| Unemployment | 2.5% | 3.5% | ||
| Average Weekly Pay (gross) | £822.80 | £702.40 | ||
| Housing | Total number of households rounded (2022 Census) | 46.500 | 2,509,300 | |
| Average Annual House Price | £289,107 | £214,596 | ||
| Average Household Size | 2.30 | 2.11 | ||
| Education | School leavers participating in Education, Training or Employment | 96.7% | 92.2% | |
| Health | Female Life Expectancy | 83.5years | 80.7 years | |
| Male Life Expectancy | 79.9 years | 76.5 years | ||
| In very good or good health | 84.9% | 82.2% | ||
| Day to day activities limited a lot | 7.8% | 9.6% | ||
| Community Safety | Crimes and offences per 10,000 population | 400 | 855 | |
| Deliberate dwelling fires per 100,000 dwellings | 19.0 | 19.6 |
Population
Population - 2011 and 2022 Census
The 2022 Census total population estimate for East Dunbartonshire is 109,000. The table below shows the Census population for East Dunbartonshire in 2011 and 2022. The population of East Dunbartonshire increased by 3.7% between the two censuses. Scotland’s population increased by 2.7% over the same time period. This is the largest population ever recorded by Scotland’s Census.
|
East Dunbartonshire - Population |
|||
|---|---|---|---|
|
|
Census 2022 |
Census 2011 |
Difference between Census 2022-2011 |
|
All |
109,000 |
105,000 |
3,900 |
|
Female |
56,500 |
54,400 |
2,100 |
|
Male |
52,400 |
50,600 |
1,800 |
The table below shows that in East Dunbartonshire, 16.5% of the total population are aged 0-14, 59.3% of the total population are aged 15-64 and 24.1% are aged 65 and over.
East Dunbartonshire has a higher proportion of the population aged 0-14 compared with Scotland as a whole (1.2%), a lower proportion of those aged 15-64 (5.3%) and a higher proportion of those aged 65 and over (4.0%).
Compared to Census 2011, East Dunbartonshire has seen a decrease in the percentage of the total population aged 15-64 (4.9%) and an increase of 4.7% in those aged 65 and over. The proportion of those aged 0-14 has remained relatively unchanged over this time period.
|
|
% of total population aged 0-14 |
% of total population aged 15-64 |
% of population aged 65+ |
|---|---|---|---|
|
East Dunbartonshire |
16.5% |
59.3% |
24.1% |
|
East Dunbartonshire |
16.4% |
64.2% |
19.4% |
|
Scotland |
15.3% |
64.6% |
20.1% |
|
Scotland |
16.1% |
67.1% |
16.8% |
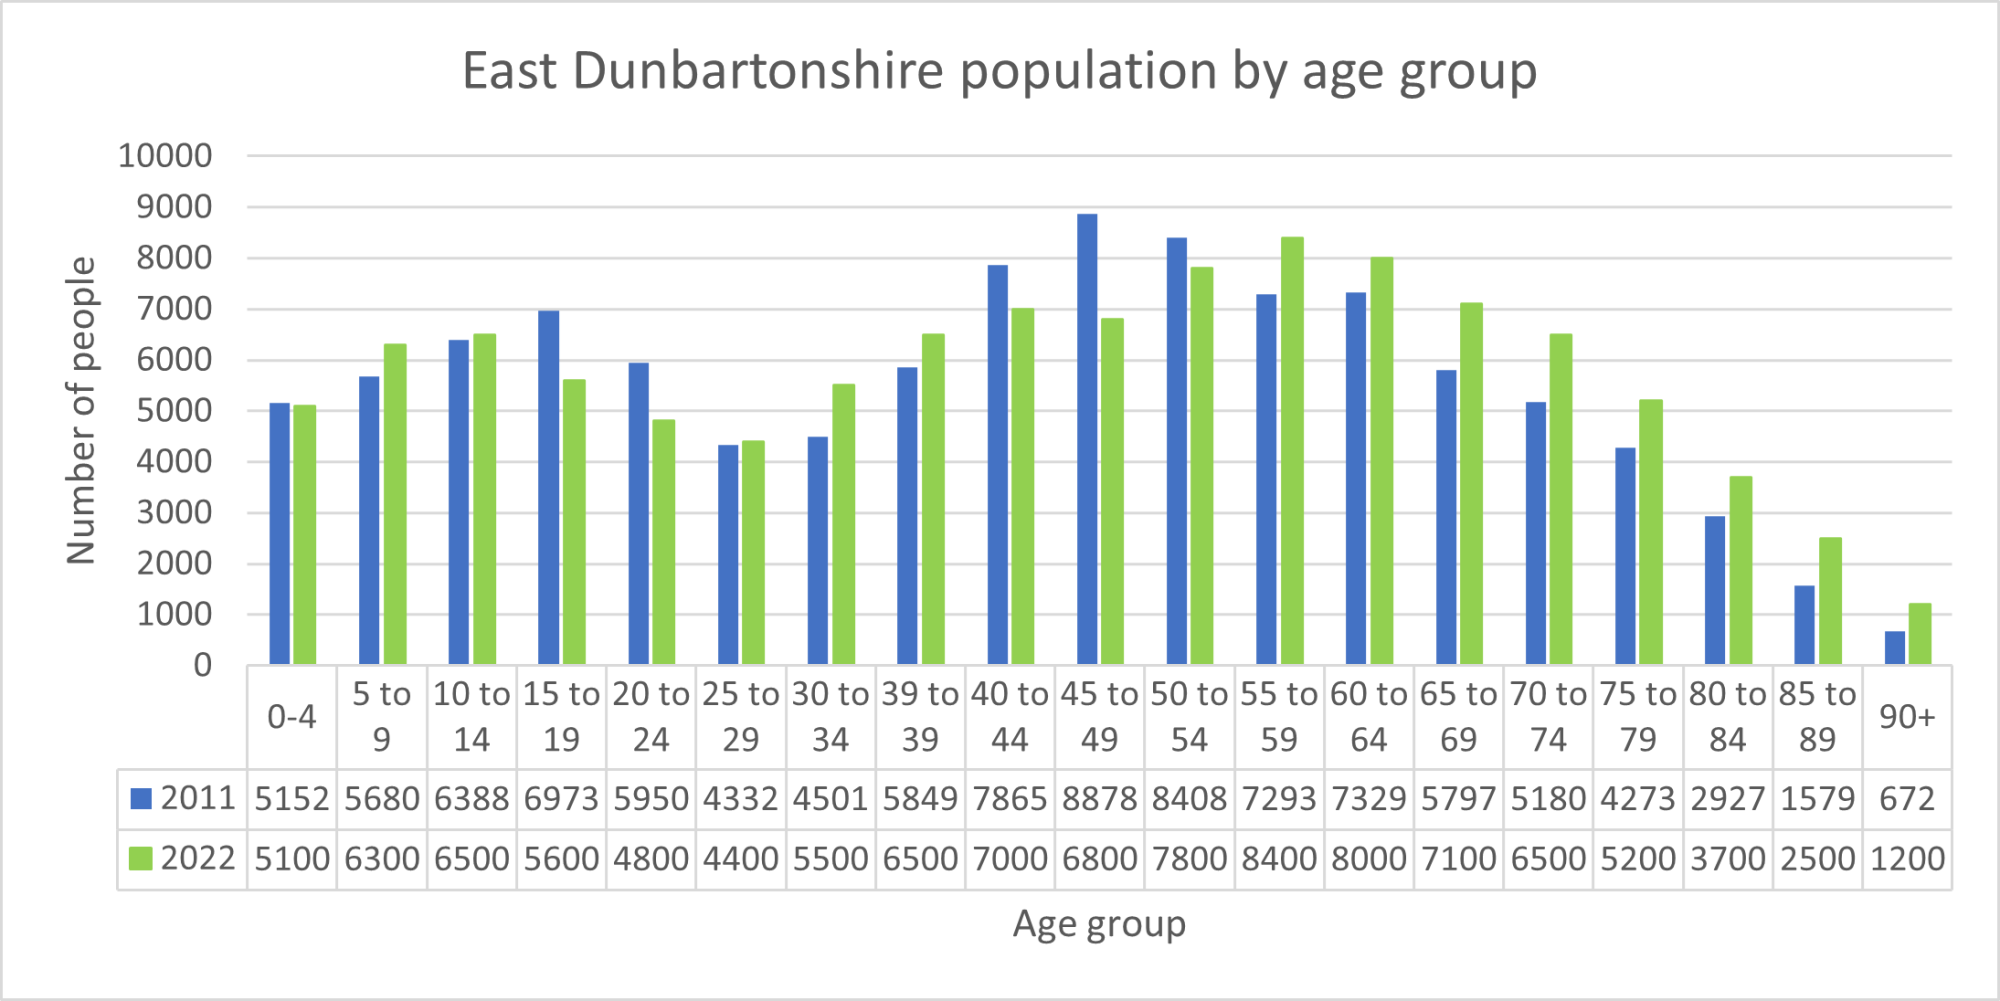
The chart below shows the structure of the population by five year age group in 2011 and 2022.
- There was a decrease in those aged 15 to 24 and those aged between 40 and 54.
- An increase was seen in those aged 55 and over, with an increase of 78% in those aged 90 and over between 2011 and 2022. This follows the predicted trend of an ageing population.
Population Estimates
2022 Mid-Year Estimates
The 2022 mid-year population estimates are produced by National Records of Scotland and are based on the 2022 Census. During the years between each census, National Records of Scotland (NRS) produces annual population estimates. Over time, these estimates gradually drift from the actual population counts until the next census is conducted. This ‘drift’ is anticipated, and it is standard procedure to revise the annual population estimates once census data becomes available. This is the first set of mid-year population estimates to incorporate the new data from Scotland’s Census 2022. Further information on population estimates and the methodology can be found on the National Records of Scotland website Mid-Year Population Estimates | National Records of Scotland (nrscotland.gov.uk)
- The 2022 Mid-Year Population estimates show that the population of East Dunbartonshire is 108,980.
- This was an increase of 3.8% compared to the 2011 Census.
Age Structure
The table below provides the broad age structure of East Dunbartonshire according to the 2022 mid-year estimates.
- 17.6% of East Dunbartonshire’s population were aged 0-15, those aged 16-64 accounted for 58.1% of the population and 24.3% were aged 65 and over.
- East Dunbartonshire had a higher percentage of its population aged 0-15 (17.6%) compared to Scotland (16.4%).
- 58.1% of the population in East Dunbartonshire were aged 16-64, this was lower compared to Scotland as a whole (63.5%).
- East Dunbartonshire had a higher percentage of its population over the age of 65 (24.3%) compared to Scotland (20.1%).
|
Population by age group |
||||
|---|---|---|---|---|
|
Area |
Total Population |
0-15 |
16-64 |
65+ |
|
East Dunbartonshire |
108,900 |
19,220 |
64,879 |
24,881 |
|
East Dunbartonshire (%) |
- |
17.6% |
58.1% |
24.3% |
|
Scotland (%) |
- |
16.4% |
63.5% |
20.1% |
Source: National Records of Scotland, 2022 Mid-Year Population Estimates
The table below shows the age structure of the older population for East Dunbartonshire.
- 11.8% of East Dunbartonshire’s population were aged over 75, over 2% higher than Scotland.
- 3.5% of the population were aged 85 and over, this was just over 1% higher when compared to Scotland (2.4%).
|
Population by age group |
||
|---|---|---|
|
Area |
75+ |
85+ |
|
East Dunbartonshire |
12,849 |
3,803 |
|
East Dunbartonshire (%) |
11.8% |
3.5% |
|
Scotland (%) |
9.1% |
2.4% |
Source: National Records of Scotland, 2022 Mid-Year Population Estimates
Male and Female Population
There are more females than males in East Dunbartonshire, 51.6% females compared to 48.4% males. This is consistent with Scotland as a whole, as shown in the table below.
|
Male and Female Population |
|||
|---|---|---|---|
|
Area |
Total |
Percentage |
Percentage |
|
Scotland |
5,447,700 |
48.6% |
51.4% |
|
East Dunbartonshire |
108,980 |
48.1% |
51.9% |
Source: National Records of Scotland, 2022 Mid-Year Population Estimates
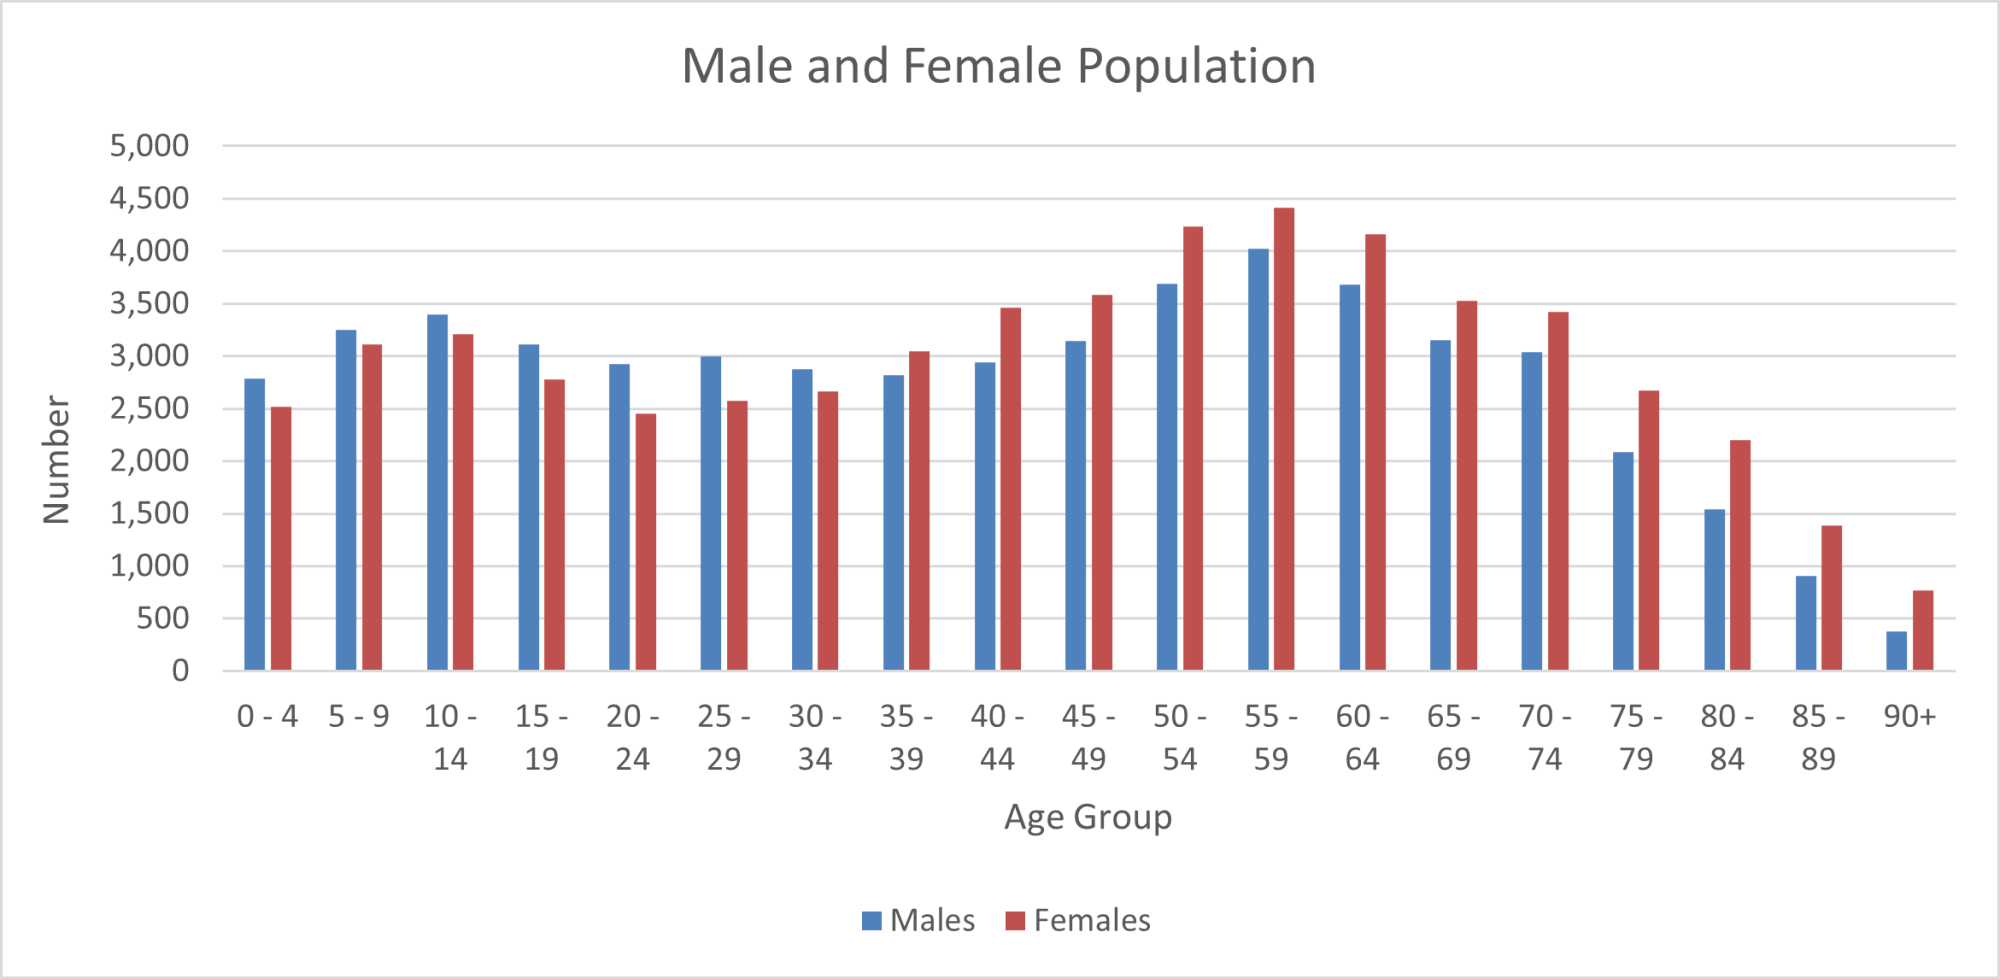
The chart below shows a slightly higher proportion of females in the older age groups (65+). This is particularly apparent in the 75+ age group. This is possibly attributed to the slightly higher life expectancy for females compared to males in East Dunbartonshire.
Source: National Records of Scotland, 2022 Mid-Year Population Estimates
Population Projections
The 2018-based population projections published by National Records of Scotland suggest that by 2028, the population of East Dunbartonshire will increase 3.8% over the next 10 years from 108,330 in 2018 to 112,008 in 2028. By 2043, East Dunbartonshire’s population is projected to be 116,315 (an increase of 7.4%).
Projected Age Structure
By 2028:
- Children aged 0-15 are projected to increase by 4.5%.
- The working age population is predicted to increase by 3%.
- Those of pensionable age and over are projected to rise by 5%.
- The highest population increase is expected to be seen in those aged 75 and over with a predicted increase of 26%.
The chart below shows the projected change in age groups for East Dunbartonshire over the next 25 years.
National Records of Scotland estimates are based on State Pension Age. As set out in the 2014 Pensions Act, between 2014 and 2018, the state pension age will rise from 62 to 65 for women. Then between 2019 and 2020, it will rise from 65 years to 66 years for both men and women. A further rise in state pension age to 67 will take place between 2026 and 2028. Between 2044 and 2046, state pension age will increase from 67 to 68.

Source: National Records of Scotland, Population Projections for Scottish Areas (2018 based)
Based on these projections, by 2043:
- 17.2% of the population will be aged 0-15,
- 56.2% will be of working age,
- 26.6% will be of pensionable age and over.
It should be noted that population projections have limitations. The projections are calculations showing what happens if particular assumptions are made about future fertility, mortality and migration. These assumptions are based on past trends and do not take account of any future changes that may occur as a result of policy initiatives but may reflect the past impact of policy or economic changes. These projections are not, therefore, forecasts of what the government expects to happen based on policy.
Life Expectancy
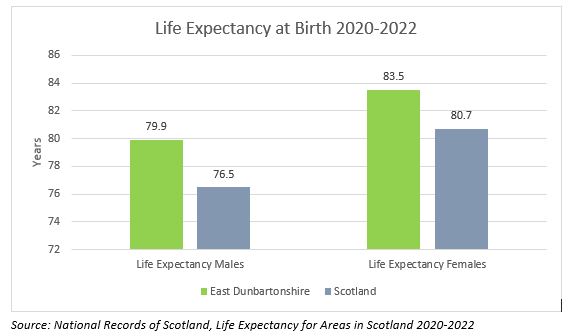
East Dunbartonshire has the highest life expectancy for males and the second highest for females in mainland Scotland.
- Life expectancy for females in East Dunbartonshire was 83.5 years, 2.8 years higher than Scotland.
- Life expectancy for males in East Dunbartonshire was 79.9 years, 3.4 years higher than Scotland.
The table below shows life expectancy for males and females in East Dunbartonshire and Scotland over the past few years. Male and female life expectancy in East Dunbartonshire remained consistent between 2019/2021 and 2020/2022.
|
Life Expectancy |
||||||
|---|---|---|---|---|---|---|
|
|
Males |
Females |
||||
|
2018-2020 |
2019-2021 |
2020-2022 |
2018-2020 |
2019-2021 |
2020-2022 |
|
|
Scotland |
76.8 years |
76.5 years |
76.5 years |
81.0 years |
80.8 years |
80.7 years |
|
East Dunbartonshire |
80.2 years |
80.0 years |
79.9 years |
83.4 years |
83.5 years |
83.5 years |
Source: National Records of Scotland – Life Expectancy for Administrative Areas within Scotland 2020-2022
Life Expectancy figures are published by National Records of Scotland and provide information at Scotland and Council level. The figures in the publication are a three year average and are produced by aggregating deaths and population data for the three year period. Life Expectancy figures are published annually. Further information on life expectancy can be accessed on the National Records of Scotland.
Ethnicity
Scotland’s Census asked people to choose the option that best described their ethnic group or background. The majority of people in Scotland chose ‘Scottish’ (77.7%) or ‘Other British’ (9.4%) within the White category.
In East Dunbartonshire, 83.4% of the population identified as ‘Scottish’ and ‘Other British’ (6.8%) within the White category. 4.3% of the population in East Dunbartonshire chose ‘Asian, Asian Scottish or Asian British’ that best described their ethnic group or background.
|
Ethnic Group – Census 2022 |
|
|
|---|---|---|
|
|
East Dunbartonshire |
Scotland |
|
White: Total |
93.4% |
92.9% |
|
White: Scottish |
83.4% |
77.7% |
|
White: Other British |
6.8% |
9.4% |
|
White: Polish |
0.3% |
1.7% |
|
White: Gypsy/Traveller |
0.01% |
0.06% |
|
Mixed or Multiple Ethnic Group |
1.1% |
1.1% |
|
Asian, Asian Scottish or Asian British: Total |
4.3% |
3.9% |
|
African: Total |
0.4% |
1.1% |
|
Caribbean or Black: Total |
0.1% |
0.1% |
|
Other Ethnic Groups: Total |
0.7% |
1.0% |
Source: Census 2022
Please note number may not add due to rounding
National Identity
The percentage of people living in Scotland who said Scottish was their only national identity increased since the previous census (from 62.4% to 65.5%). The percentage who said their only national identity was British also increased (from 8.4% to 13.9%). The percentage who said they felt Scottish and British decreased (from 18.3% to 8.2%).
The majority of the population of East Dunbartonshire reported Scottish was their only national identity (64.4%).
|
National Identity - Census 2022 |
||
|---|---|---|
|
|
East Dunbartonshire |
Scotland |
|
Scottish identity only |
64.4% |
65.5% |
|
British identity only |
16.5% |
13.9% |
|
Scottish and British identities only |
12.1% |
8.2% |
|
Scottish and any other identities |
1.9% |
2.0% |
|
English identity only |
1.2% |
2.3% |
|
Any other combination of UK identities (UK only) |
0.9% |
1.2% |
|
Other identity only |
2.8% |
6.5% |
|
Other identity and at least one UK identity |
0.2% |
0.3% |
Source: Census 2022
Please note number may not add due to rounding
Country of Birth
Population change is driven by births, deaths and migration (people moving into or out of Scotland). The increase in Scotland’s minority ethnic population is partly explained by people moving to Scotland from overseas between 2011 and 2022. The percentage of people born outside the UK increased between 2011 and 2022. An increasing share of births in Scotland are to mothers born outside the UK.
The table below shows the country of birth for East Dunbartonshire and Scotland.
|
Country of Birth – Census 2022 |
||
|---|---|---|
|
|
East Dunbartonshire |
Scotland |
|
United Kingdom: Total |
93.8% |
89.8% |
|
Europe: EU Member Countries in March 2022: Total |
1.7% |
4.3% |
|
Europe: Non EU Countries: Total |
0.2% |
0.3% |
|
Africa: Total |
0.8% |
1.3% |
|
Middle East and Asia: Total |
2.6% |
3.0% |
|
The Americas and the Caribbean: Total |
0.7% |
0.9% |
|
Antarctica and Oceania: Total |
0.2% |
0.3% |
|
Other |
0.0% |
0.0% |
Source: Census 2022
Please note number may not add due to rounding
The 2011 Census question on marital status was extended from that asked in 2001 to include new categories for registered same-sex civil partnerships. 2022 Census data for marital status has not yet been released.
- 55% of East Dunbartonshire’s population aged 16 and over were married, this was 10% higher than Scotland as a whole.
- 28.2% of those aged 16 and over in East Dunbartonshire were single (never married or never registered a same-sex civil partnership).
|
Marital Status – Census 2011 |
|||||||
|---|---|---|---|---|---|---|---|
|
|
All people aged 16 and over |
Percentage Single (never married or never registered a same-sex civil partnership) |
Percentage Married |
Percentage in a registered same-sex civil partnership |
Percentage Separated (but still legally married or still legally in a same-sex civil partnership |
Percentage divorced or formerly in same sex civil partnership which is now legally dissolved |
% widowed or surviving partner from a same-sex civil partnership |
|
Scotland |
4,379,072 |
35.4% |
45.2% |
0.2% |
3.2% |
8.2% |
7.8% |
|
East Dunbartonshire |
86,312 |
28.2% |
55.0% |
0.1% |
2.7% |
5.9% |
8.0% |
Source: 2011 Census
Registered Marriages
The table below shows the number of marriages registered in East Dunbartonshire decreased between 2018 and 2020 and then increased in 2021 and 2022. This could potentially be due to COVID-19 restrictions.
|
Registered Marriages |
|
|---|---|
|
Year |
Total Marriages |
|
2018 |
222 |
|
2019 |
198 |
|
2020 |
107 |
|
2021 |
227 |
|
2022 |
352 |
Source: National Records of Scotland, Vital Events Figures 2018-2022
Over time, the number of marriages registered annually has decreased in East Dunbartonshire, as shown in the chart below. In 1991, 856 marriages were registered compared to only 352 in 2022, a decrease of 59%.

Source: National Records of Scotland, Vital Events Figures – time series
Language
The table below shows the English language skills reported in the 2022 Census for East Dunbartonshire and Scotland as a whole.
|
English Language Skills - Census 2022 |
||
|---|---|---|
|
|
East Dunbartonshire |
Scotland |
|
Understands spoken English only |
0.27% |
0.37% |
|
Speaks, reads and writes English |
95.23% |
94.18% |
|
Speaks but does not read or write English |
2.93% |
2.98% |
|
Speaks and reads but does not write English |
0.6% |
0.88% |
|
Reads but does not speak or write English |
0.07% |
0.13% |
|
Writes but does not speak or read English |
0.0% |
0.02% |
|
Reads and writes but does not speak English |
0.07% |
0.15% |
|
Other combinations of skills in English |
0.09% |
0.14% |
|
Limited English skills |
0.65% |
0.98% |
|
No skills in English |
0.09% |
0.17% |
Source: Census 2022
Please note number may not add due to rounding
Gaelic Language Skills
Scotland’s Census found that 2.5% of people aged 3 and over in Scotland had some skills in Gaelic in 2022. In Na h-Eileanan Siar the majority had some Gaelic skills (57.2%). In East Dunbartonshire, 1.8% of the population aged 3 and over had some skills in Gaelic.
|
Gaelic Language Skills - Census 2022 |
||
|---|---|---|
|
|
East Dunbartonshire |
Scotland |
|
No skills in Gaelic |
98.23% |
97.54% |
|
Understands but does not speak, read or write Gaelic |
0.57% |
0.88% |
|
Speaks, reads and writes Gaelic |
0.65% |
0.83% |
|
Speaks but does not read or write Gaelic |
0.23% |
0.34% |
|
Speaks and reads but does not write Gaelic |
0.1% |
0.14% |
|
Reads but does not speak or write Gaelic |
0.18% |
0.2% |
|
Other combination of skills in Gaelic |
0.04% |
0.06% |
Source: Census 2022
Please note number may not add due to rounding
Scots Language Skills
The percentage with Scots skills was higher in the north east of Scotland. Aberdeenshire had the highest percentage with some Scots skills (64.1%) and Na h-Eileanan Siar had the lowest (30.7%). In East Dunbartonshire 35.9% of the population aged over 3 had some Scots language skills.
|
Scots Language Skills - Census 2022 |
||
|---|---|---|
|
|
East Dunbartonshire |
Scotland |
|
No skills in Scots |
64.1% |
53.8% |
|
Understands but does not speak, read or write Scots |
11.7% |
13.6% |
|
Speaks, reads and writes Scots |
16.3% |
22.2% |
|
Speaks but does not read or write Scots |
1.9% |
3.3% |
|
Speaks and reads but does not write Scots |
2.0% |
3.0% |
|
Reads but does not speak or write Scots |
3.8% |
3.7% |
|
Other combination of skills in Scots |
0.3% |
0.4% |
Source: Census 2022
Please note number may not add due to rounding
British Sign Language
The census included a new question on the use of BSL in 2022. This means there is not comparable data for previous censuses. The new question asked whether people can use BSL. In the previous census information on BSL use was only collected through the question “Do you use a language other than English at home?”
Scotland’s Census found that 117,300 people can use British Sign Language (BSL), 2.2% of people aged 3 and over. In East Dunbartonshire, 1.6% of the population reported they were a British Sign Language user.
|
British Sign Language – Census 2022 |
||
|---|---|---|
|
|
East Dunbartonshire |
Scotland |
|
British Sign Language User |
1.6% |
2.2% |
|
Not a British Sign Language User |
98.4% |
97.8% |
Source: Census 2022
Please note number may not add due to rounding
Religion
Scotland’s Census asked people what religion they belong to. This was a voluntary question, first used in 2001. In 2022, 6.2% of people did not answer the religion question. Percentages are calculated using the overall population, not just those who answered the religion question.
For the first time in Scotland’s Census, the majority of people said they had no religion. In 2022, 51.1% of people in Scotland reported they had no religion. In East Dunbartonshire 43.3% of the population stated they had no religion, as show in the table below.
|
Religion – Census 2022 |
||
|---|---|---|
|
|
East Dunbartonshire |
Scotland |
|
No religion |
43.3% |
51.1% |
|
Religion not stated |
6.6% |
6.2% |
|
Church of Scotland |
23.4% |
20.4% |
|
Roman Catholic |
18.9% |
13.3% |
|
Other Christian |
4.4% |
5.1% |
|
Buddhist |
0.2% |
0.3% |
|
Hindu |
0.8% |
0.6% |
|
Jewish |
0.05% |
0.1% |
|
Muslim |
1.3% |
2.2% |
|
Sikh |
0.8% |
0.2% |
|
Pagan |
0.2% |
0.4% |
|
Other religion |
0.2% |
0.2% |
Source: Census 2022
Please note number may not add due to rounding
Migration
Migration is the movement of people from one place to another. Internal migration is when people migrate within the same country or region and international migration is when people migrate from one country to another.
Migration is the most difficult component of population change to estimate as, unlike births and deaths, there is no comprehensive system which registers migration in the UK – whether migration to or from overseas, migration to or from other parts of the UK or migration within Scotland. Estimates of migration therefore have to be based on survey data and the best proxy data available.
There are three key sources of migration data:
- The National Health Service Central Register (NHSCR) is used to calculate moves between NHS Board areas within the UK. It is also used to distribute estimates of international migration to NHS Board areas in Scotland.
- Community Health Index (CHI) is used to estimate migration at Council area and below.
- International Passenger Survey (IPS) provides information on moves into and out of Scotland with an origin or destination of outside UK.
Total migration includes all migration to, or from, an area. For Scotland, this would include moves to and from the rest of the UK and moves to and from overseas whilst for a Council or NHS Board area it would also include moves to and from other such areas in Scotland.
The COVID-19 pandemic restricted movement across the UK and overseas under the first national lockdown and has impacted many of the data sources which feed into migration statistics. For example, overseas migration was previously estimated using the International Passenger Survey (IPS). However, in March 2020 the IPS was suspended due to the COVID-19 pandemic. The latest figures were produced using a new method that relies less on IPS data and statistical modelling, and makes greater use of administrative data. Due to this change in method, the latest figures on international migration may not be comparable with previous estimates.
More information about the impact of data sources can be found in the accompanying report to the 2021 population and migration estimates on the National Records of Scotland website.
The chart below shows the net migration to and from East Dunbartonshire from 2002/03 to 2020/21. There was a negative net migration for East Dunbartonshire from 1995/96 to 2010/11. The first positive total net migration since 1994/95 was seen in 2011/12. During 2020/21, there was an estimated total net migration into East Dunbartonshire of 4,500 people and a total net out migration of 4,010 people resulting in a positive net migration of 490 people.

Source: National Records of Scotland, Migration to and from Council Areas 2020/21
The chart below shows the flow of people moving between East Dunbartonshire and the rest of the UK, and between East Dunbartonshire and overseas during 2020/21. The majority of people coming in to East Dunbartonshire were from within Scotland (+540) and a small number from overseas (+10). Net migration from the rest of the UK was -60.

Source: National Records of Scotland, Migration to and from Council Areas 2020/21
Migration statistics are produced by National Records of Scotland and are published annually. Migration is the most difficult component of population change to estimate. There is no comprehensive system which registers migration in the UK. Estimates of migration therefore have to be based on survey data and the best proxy data that exists. For more information visit National Records of Scotland.
Housing

Tenure
Tenure provides information about whether a household rents or owns the accommodation that it occupies and if rented, combines this with information about the type of landlord who owns or manages the accommodation.
- 39.8% of homes were owned outright in East Dunbartonshire. This is 12% higher than the Scottish average (27.8%).
- 41.4% of homes in East Dunbartonshire were owned with a mortgage or loan. This is also higher than the Scottish average (33.7%).
- 8.5% of homes in East Dunbartonshire were Council rented, nearly 5% lower than Scotland as a whole (22.1%).
|
Tenure |
|||||||||
|---|---|---|---|---|---|---|---|---|---|
|
Area |
All Households |
Owned outright |
Owned with a mortgage or loan |
Shared owner -ship (part owned & part rented) |
Council rented |
Other social rented |
Private rented |
Rented: other |
Living rent free |
|
Scotland |
2,372,777 |
27.8% |
33.7% |
0.4% |
13.2% |
11.1% |
11.1% |
1.3% |
1.3% |
|
East Dunbartonshire |
43,473 |
39.8% |
41.4% |
0.2% |
8.5% |
3.5% |
5.1% |
0.6% |
0.9% |
Source: 2011 Census
Household Composition
A household is defined as one person living alone or a group of people (not necessarily related) living at the same address who share cooking facilities and share a living room or sitting room or dining area.
A family is defined as a married, civil partnered or cohabiting couple (with or without children), or a lone parent with at least one child. Children may be classed as dependent or non-dependent. Dependent children are those aged under 16, or aged 16-18 and in full-time education, living with at least one parent, excluding those who have a spouse, partner or child living in the household.
- 11.8% of East Dunbartonshire households were one person households. This was slightly lower than Scotland (15.8%).
- 20.3% of households in East Dunbartonshire consisted of two adults and one or two children.
- Households with three or more adults and no children was the largest household type.
|
Household Composition |
East Dunbartonshire |
Scotland |
|---|---|---|
|
One person household1 |
11.8% |
15.8% |
|
No adults or one adult and one or more children |
4.4% |
6.2% |
|
One adult aged 16-64 and one aged 65 and over and no children or two adults aged 65 and over and no children |
12.9% |
10.7% |
|
Two adults and one or two children |
20.3% |
19.1% |
|
Two adults aged 16-64 and no children |
12.7% |
17.5% |
|
Two adults and three or more children |
5.2% |
4.7% |
|
Three or more adults and one or more children |
10.6% |
8.9% |
|
Three or more adults and no children |
22.1% |
17.0% |
Source: 2011 Census
Households Estimates
Household Estimates and Projections are produced by National Records of Scotland. Household Estimates provides the estimates of the number of households and dwellings in Scotland and Council areas and are released annually. Household Projections are produced every second year and cover a projection period of 25 years. They show the projected number of households in Scotland and Council areas. Please select the following link to access further information relating to previous household estimates and projections [opens in a new window].
A dwelling refers to the accommodation itself, for example a house or a flat and includes second homes that are not let out commercially. Caravans count as dwellings if they are someone’s main home.
A household refers to the people living together in a dwelling. The number of dwellings will not necessarily equal the number of households in an area, because some dwellings are vacant or second homes, and some dwellings contain more than one household. Communal establishments, such as care homes and student halls of residence, are not included in the definition of a household. Household estimates come from Council Tax records.
- 2021 household and dwelling estimates provides an estimate of 47,549 dwellings and 46,849 households in East Dunbartonshire.
- Between 2020 and 2021, there was an increase of 286 households (0.6%) and 298 (0.6%) dwellings in East Dunbartonshire.
Over the last 10 years households and dwellings in East Dunbartonshire have been consistently increasing, as shown in the chart below.

Source: National Records of Scotland, 2021 Household and Dwelling Estimates
Households by Council Tax Band
- The majority of households in East Dunbartonshire were in Council Tax Band D-E, 13% higher than Scotland as whole.
|
Households by Council Tax Band 2021 |
|||
|---|---|---|---|
|
Area |
% households in Council Tax Band A-C |
% households in Council Tax Band D-E |
% households in Council Tax Band F-H |
|
Scotland |
59% |
27% |
14% |
|
East Dunbartonshire |
28% |
40% |
32% |
Source: National Records of Scotland, 2021 Household and Dwelling Estimates
Average Household Size
According to the 2021 Household and Dwelling Estimates:
- East Dunbartonshire had an average household size of 2.31, higher than the Scottish average of 2.12.
- Average household size in East Dunbartonshire has decreased by -3.8% over the last ten years, from 2.40 in 2011 to 2.31 in 2021. This is also the case for Scotland as a whole, with a decrease of -3.2% in average household size over the same time period, as shown in the chart below.
- Average household size has been on a largely downward trend for many years. This decrease is partly due to changes in the way we live and partly due to an ageing population, as older people are more likely to live alone or in smaller households. In addition, a growing proportion of older people are living in their own homes rather than care homes.

Source: National Records of Scotland, 2021 Household and Dwelling Estimates Estimates
Average Annual House Price
- In 2023, the average annual house price for a residential property in East Dunbartonshire was £292,221. This was £75,857 higher than the Scottish average.
- Between 2022 and 2023, the average annual house price n East Dunbartonshire increased by 1.1%. Scotland as a whole also experienced an increase (+0.8%) over the same time period.
- COVID-19 had an impact on the property market during the first quarter of 2020/21 with fewer transactions than expected due to government measures to reduce the spread of COVID-19.
|
Average Annual House Price |
||||
|---|---|---|---|---|
|
Area |
Average House Price 2021 |
Average House Price 2022 |
Average House Price 2023 |
Annual % Change 2022-2023 |
|
Scotland |
£201,502 |
£214,567 |
£216,364 |
+0.8% |
|
East Dunbartonshire |
£275,348 |
£289,137 |
£292,221 |
+1.1% |
Source: Registers of Scotland Average Residential Property Price 2023
The average house price in East Dunbartonshire in January 2022 was £303,376 there were some decreases throughout the year but on the whole house prices remained reasonably consistent. The highest average house price in 2023 was £323,464 in September.

Source: Registers of Scotland, Monthly House Price Statistics 2023.
Household Projections
The 2018-based household projections published by National Records of Scotland suggest that by 2043 there will be 51,681 households in East Dunbartonshire. This would be an increase of 5,658 households (12.3%) between 2018 and 2043 as shown in the chart below. The number of households is projected to increase faster than the population. This is a result of more people living alone or in smaller households.
The household projections have limitations. A projection is a calculation showing what happens if particular assumptions are made. The household projections are trend based and are not, therefore, policy based forecasts of what the Government expects to happen. Specifically, the assumptions do not take account of the June 2016 referendum vote to leave the European Union.

Source: National Records of Scotland, 2018-based Household Projections
The chart below shows the projected number of household types in 2018 and 2043.
- The number of households with two adults 1+ children and households with three adults is projected to decrease between 2018 and 2043.
- There is a projected increase in one adult households over the same time period.
- One adult 1+ children and two adult households are projected to remain unchanged between 2018 and 2043.

Source: National Records of Scotland, 2018-based Household Projections
Local Economy
NOMIS
Average Weekly Earnings
- The average gross weekly earnings for full time workers living in East Dunbartonshire in 2023 was £822.80. This was substantially higher (£120) than Scotland as a whole (£702.40).
- In 2023, male full time workers living in East Dunbartonshire earned £22.20 more than female full time workers. Across Scotland, male full time workers earned £53.70 more than female full time workers.
- Both female and male full time workers living in East Dunbartonshire had higher gross weekly earnings compared to males and females across Scotland as a whole.
|
Average Weekly Earnings (Gross) 2022 |
|||
|---|---|---|---|
|
|
Full Time Workers |
Male Full Time Workers |
Female Full Time Workers |
|
Scotland |
£702.40 |
£725.70 |
£672.00 |
|
East Dunbartonshire |
£822.80 |
£833.50 |
£811.30 |
Source:NOMIS – ONS Annual Survey of Hours and Earnings (2023)
Median earnings for employees living in the area
Over the COVID-19 pandemic period, earnings estimates were affected by changes in composition of the workforce and the impact of the Job Retention Scheme (furlough) making interpretation difficult; also data collection disruption and lower response rates mean that for 2020 and 2021, data were subject to more uncertainty and should be treated with caution; users are encouraged to focus on longer term trends rather than year on year changes.

Source: Median earnings for employees living in the area – ONS Annual Survey of Hours and Earnings (2023)
|
Average Weekly Earnings |
||
|---|---|---|
| Area |
East Dunbartonshire |
Scotland |
|
2013 |
£596.10 |
£507.90 |
|
2014 |
£606.20 |
£518.60 |
|
2015 |
£617.90 |
£527.00 |
|
2016 |
£631.30 |
£536.60 |
|
2017 |
£633.90 |
£547.70 |
|
2018 |
£684.70 |
£562.70 |
|
2019 |
£700.60 |
£577.70 |
|
2020 |
£726.30 |
£595.00 |
|
2021 |
£754.70 |
£622.00 |
|
2022 |
£745.30 |
£640.30 |
|
2023 |
£822.80 |
£702.40 |
Source: Median earnings for employees living in the area – ONS Annual Survey of Hours and Earnings (2023)
Employment and Unemployment
In the UK during the COVID-19 pandemic, there was a decrease in the employment rate and increases in the economic activity and unemployment rates for both men and women. Young people (aged 16-24 years) were particularly affected by the COVID-19 pandemic, with the employment rate decreasing and the unemployment and economic activity rates increasing by more in comparison with those aged 25 years and over. There has been an increase in the employment rate and a decrease in the unemployment rate to below pre-coronavirus rates.
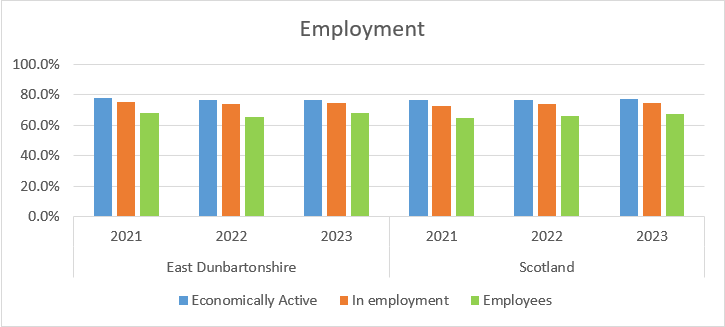
The table below shows the percentage of economically active residents in East Dunbartonshire.
- The percentage of economically active residents in East Dunbartonshire had a slight decrease from 76.8% to 76.3% between 2022 and 2023.
- In East Dunbartonshire, people in employment increased from 73.7% in 2022 to 74.7% in 2023 and was in line with the Scottish average.
- Unemployment in East Dunbartonshire decreased between 2022 and 2023 from 2.9% to 2.5% respectively and was 1% lower than the Scottish average of 3.5%.
- There was a higher proportion of economically active males (80.2%) in East Dunbartonshire compared to females (72.6%).
|
Economic Activity |
||||||
|---|---|---|---|---|---|---|
|
Area |
East Dunbartonshire |
Scotland |
||||
|
Year |
2021 |
2022 |
2023 |
2021 |
2022 |
2023 |
|
Economically Active* |
78.1% |
76.8% |
76.3% |
76.5% |
76.5% |
77.4% |
|
In employment* |
75.5% |
73.7% |
74.7% |
72.8% |
73.8% |
74.7% |
|
Employees* |
68.2% |
65.6% |
68.1% |
64.8% |
65.8% |
67.3% |
|
Self-employed* |
7.1% |
8.0% |
6.1% |
7.8% |
7.8% |
7.1% |
|
Unemployed (model based)# |
3.7% |
2.9% |
2.5% |
4.7% |
3.4% |
3.5% |
Source: NOMIS (Office for National Statistics )(April – March)
* for those aged 16-64
# numbers and % are for those aged 16 and over, % is a proportion of economically active
The chart and table below show the percentage of people that are economically active, in employment and are employees in East Dunbartonshire and Scotland.
Source: NOMIS (Office for National Statistics April - March)
|
Economic Activity |
||||||
|---|---|---|---|---|---|---|
|
Area |
East Dunbartonshire |
Scotland |
||||
|
Year |
2021 |
2022 |
2023 |
2021 |
2022 |
2023 |
|
Economically Active* |
78.1% |
76.8% |
76.3% |
76.5% |
76.5% |
77.4% |
|
In employment* |
75.5% |
73.7% |
74.7% |
72.8% |
73.8% |
74.7% |
|
Employees* |
68.2% |
65.6% |
68.1% |
64.8% |
65.8% |
67.3% |
Out of Work Benefits
Under Universal Credit a broader span of claimants are required to look for work than under Jobseeker’s Allowance. As Universal Credit Full Service is rolled out in particular areas, the number of people recorded as being on the Claimant Count is therefore likely to rise.
The table below shows the percentage of the population aged 16-64 claiming main out of work benefits in East Dunbartonshire.
- Between 2022 and 2023, there was very slight decrease in the working age population claiming out of work benefits in East Dunbartonshire.
- There was a higher number of male claimants (2.3%) compared to females (1.6%) in East Dunbartonshire.
|
Out of Work Benefits Claimant Count* |
|||
|---|---|---|---|
|
Year |
2021 |
2022 |
2023 |
|
Scotland |
5.0% |
3.2% |
3.2% |
|
East Dunbartonshire |
3.2% |
2.0% |
1.9% |
Source: ONS Claimant Count, July (NOMIS website) not seasonally adjusted
*percentage is the number of claimants as a proportion of resident population of area aged 16-64
Claimant Count by Age
The table below shows the out of work benefit claimants by age group for East Dunbartonshire.
- Those aged 18-24 and 25-49 had the largest proportion claiming out of work benefits at 2.9% and 2.4% respectively.
|
Claimant Count by Age* |
||||
|---|---|---|---|---|
|
Age Group |
Age 16-17 |
Age 18-24 |
Age 25-49 |
Age 50+ |
|
Scotland |
0.6% |
4.5% |
3.6% |
2.1% |
|
East Dunbartonshire |
0.2% |
2.9% |
2.4% |
1.2% |
Source: ONS Claimant Count by age, July 2023 (NOMIS website) not seasonally adjusted
*percentage is the number of claimants as a proportion of a resident population of the same age
Employment by Occupation
The largest category of occupation in East Dunbartonshire was Professional Occupations (35.8%), followed by Associate Professional and Technical (16.4%).
|
Employment by Occupation |
||
|---|---|---|
|
Area |
East Dunbartonshire |
Scotland |
|
Managers, directors & senior officials |
9.7% |
8.2% |
|
Professional occupations |
35.8% |
25.6% |
|
Associate professional & technical |
16.4% |
15.1% |
|
Administrative & secretarial |
9.5% |
9.1% |
|
Skilled trades occupation |
6.6% |
9.5% |
|
Caring, leisure & other service occupation |
6.8% |
8.5% |
|
Sales & customer service |
4.5% |
7.5% |
|
Process, plant & machine operatives |
4.6% |
5.1% |
|
Elementary occupations |
5.4% |
10.9% |
Source: ONS Annual Population Survey (April 2022 – March 2023) from NOMIS website
# sample size too small for reliable estimate
Businesses
There are around 3,000 businesses in East Dunbartonshire.
|
Businesses 2022 |
||||
|---|---|---|---|---|
|
Size |
Micro |
Small |
Medium |
Large |
|
Scotland |
81.2% |
15.3% |
3.0% |
0.5% |
|
East Dunbartonshire |
85.5% |
11.8% |
2.4% |
0.1% |
Source: NOMIS – Local Units - UK Business Counts 2022 (ONS Inter Departmental Business Register)
Child Benefit
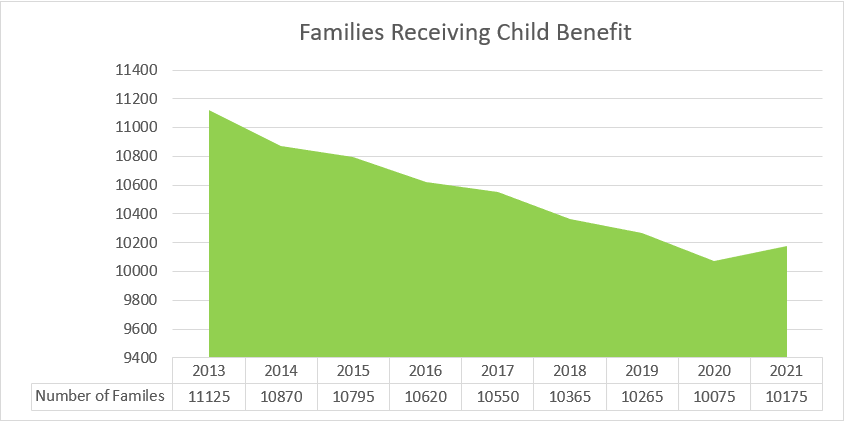
Child benefit is paid to those responsible for children (aged under 16) or qualifying young people. In Scotland, there were 532,180 families responsible for 878,235 children and qualifying young people, receiving Child Benefit. There were 10,175 families in East Dunbartonshire in receipt of Child Benefit in 2021. Following the introduction of the High Income Child Benefit Charge in January 2013, there has generally been a steady decrease in the number of families in East Dunbartonshire in receipt of Child Benefit, although there was a slight increase in 2021.
Source: Department of Work and Pensions Child Benefit Statistics
The table below shows the number of families in East Dunbartonshire who were in receipt of child benefit as of 31 August 2021. The largest family type in receipt of child benefit were families with one child, this was also the case for Scotland as a whole.
|
Families in Receipt of Child Benefit 2021 |
||||||
|---|---|---|---|---|---|---|
|
Amount |
Total Number of Families |
Families with one child |
Families with two children |
Families with three children |
Families with four children |
Families with five or more children |
|
East Dunbartonshire |
10,175 |
4,935 |
4,160 |
920 |
135 |
30 |
Source: Department of Work and Pensions (as of 31 August 2021)
DWP has rounded figures to the nearest 5 and numbers may not add up to total shown
The table below shows the number of children in families that were receiving child benefit in 2021. The majority of children were aged 5-10 years (5,800) and this was closely followed by children aged 11-15 years (4,820).
|
Number of Children in Families Claiming Child Benefit 2021 |
|||||
|---|---|---|---|---|---|
|
Number of children |
Total number of children |
Number of Children in families aged under 5years |
Number of children in families aged 5-10 years |
Number of children in families aged 11-15 years |
Number of children in families aged 16 and over |
|
East Dunbartonshire |
16,705 |
3,720 |
5,855 |
5055 |
2,075 |
Source: Department of Work and Pensions (as of 31 August 2021)
*DWP has rounded figures to the nearest 5 and numbers may not add up to total shown
Children in Families with Limited Resources
Statistics on children in families with limited resources were published by the Scottish Government in November 2017 and updated in 2019. It should be noted that these statistics are experimental and provide estimates of the proportion of children in families with combined low income and material deprivation. The statistics are based on figures from the Scottish Household Survey. Families were considered to have a low income if the household income was below 70% of the Scottish average income after housing costs. Material deprivation was defined as families unable to afford three or more basic necessities from a list of 22.
The key findings highlighted that children who live in households with a single parent, adults with a disability, at most one adult in employment, or three or more siblings, are more likely to have limited resources. Children who live in families with two or more adults, or at least two adults in employment, are less likely to have limited resources.
Children are also more likely to live in families with limited resources if they live in a rented property, or in the most deprived areas, compared with Scotland as a whole. Children are less likely to live in families with limited resources if they live in an accessible rural area, or if they live in the least deprived areas.
The table below shows that East Dunbartonshire has an estimated 8.4% of children who live in families with limited resources before and after housing costs, considerably lower than Scotland as a whole.
|
Children in Families with Limited Resources 2017-19 |
||
|---|---|---|
|
Area |
East Dunbartonshire |
Scotland |
|
Percentage of children who live in families with limited resources – After Housing Costs |
8.4% |
16.6% |
|
Percentage of children who live in families with limited resources – Before Housing Costs |
8.4% |
13.9% |
Source: Scottish Government 2019
Education

Attainment
East Dunbartonshire pupils continue to perform well, achieving high levels of attainment. In East Dunbartonshire, 84.7% of S5 pupils achieved 1+ Level 6 (Higher Level and above) in 2021. There has been an improvement in the following measures compared to previous years: S5 Students achieving 1+, 3+ and 5+ or more awards at Level 6 (Higher).
|
S4 Pupils |
2018 DIET |
2019 DIET |
2020 * DIET |
2021 * DIET |
|
|---|---|---|---|---|---|
|
5+ Level 5 |
National 5 and above |
69.6% |
67.3% |
76.2% |
74.0% |
|
S5 Pupils |
2018 DIET |
2019 DIET |
2020 * DIET |
2021 * DIET |
|
|---|---|---|---|---|---|
|
1+ Level 6 |
Higher Level and above |
78.9% |
82.1% |
83.8% |
84.7% |
|
3+ Level 6 |
Higher Level and above |
60.9% |
61.6% |
68.7% |
71.6% |
|
5+ Level 6 |
Higher Level and above |
35.6% |
39.3% |
44.2% |
46.8% |
|
S6 Pupils |
2018 DIET |
2019 DIET |
2020 * DIET |
2021 * DIET |
|
|---|---|---|---|---|---|
|
3+ Level 6 |
Higher Level and above |
33.4% |
31.7% |
44.6% |
45.0% |
|
1+ Level 7 |
Advanced Higher Level |
35.9% |
32.6% |
40.6% |
41.1% |
Source: East Dunbartonshire Council
* The COVID-19 pandemic resulted in the use of a different approach to assessment in the summer of 2020. It is important that any interpretation of the above data is within that context.
Annual Participation Measure
The annual participation measure reports on the activity of the wider 16-19 year old group, including those young people at school. The table below shows information from the 2021 report published by the Scottish Government. A high proportion of school leavers in East Dunbartonshire (96.7%) were participating in education, training or employment, this was higher than Scotland as a whole (92.2%). The percentage of school leavers who were not participating remains low with only 0.8% in this category compared to 3.2% for Scotland.
Of the 96.1% of 16-19 year olds in East Dunbartonshire who were participating in education, training or employment, 84.5% were participating in Education, 10.7% in employment and 1.0% in other training and development.
|
Annual Participation Measure 2021 |
|||
|---|---|---|---|
|
Area |
Participating in Education, Training or Employment |
Not Participating (those unemployed seeking employment and others unemployed and not seeking employment) |
Unconfirmed Status |
|
Scotland |
92.2% |
3.2% |
4.6% |
|
East Dunbartonshire |
96.7% |
0.8% |
2.5% |
Source: Skills Development Scotland – 2021 Annual Participation Measure Report
Crime/Community Safety
Crime Rates per 10,000 Population
East Dunbartonshire is regarded as a safe place to live with the level of crime being significantly lower than the Scottish average with 400 crimes and offences per 10,000 population in 2021/22 compared to the Scottish average of 855 per 10,000 population. The rate of crime per 10,000 population in East Dunbartonshire was lower than the Scottish average in all categories as shown in the table below.
|
Recorded Crime per 10,000 population |
||
|---|---|---|
|
Crimes |
Scotland |
East Dunbartonshire |
|
Non-sexual crimes of violence |
127 |
61 |
|
Sexual crimes |
28 |
12 |
|
Crimes of dishonesty |
170 |
93 |
|
Damage and reckless behaviour |
81 |
37 |
|
Crimes against society |
112 |
56 |
|
Road traffic offences |
205 |
72 |
|
Misc. offences |
24 |
17 |
Source: Scottish Government, Recorded Crime in Scotland per 10,000 population 2021/22
The chart below shows that East Dunbartonshire had the lowest rate of crime per 10,000 population compared to the surrounding local authority areas.

Source: Scottish Government, Recorded Crime in Scotland 2021/22
Accidental and Deliberate Fires
The table below shows Primary Fires* by location for East Dunbartonshire. The total number of fires in East Dunbartonshire in 2020/21 was 376 (130 primary fires*, 241 secondary fires# and 5 chimney fires).
|
Number of Primary Fires by Location 2020/21 |
|||||
|---|---|---|---|---|---|
|
Primary Fires |
Dwellings |
Other Buildings |
Road Vehicles |
Others |
Total Primary Fires |
|
Primary Fires 2019/20* |
74 |
21 |
27 |
8 |
130 |
Source: Scottish Fire and Rescue Service Incident Statistics Scotland 2020/21
*Primary Fires include all fires in buildings, vehicles and most outdoor structures, or any fire involving casualties or rescues, or fires attended by five or more appliances.
# Secondary Fires are the majority of outdoor fires, where there was no loss of property and no casualties
East Dunbartonshire had a lower incidence of total primary fires per 100,000 population (119.5) compared to 172.3 for Scotland as a whole. The table below shows primary fires by location per 100,000 for East Dunbartonshire, Scotland and the surrounding local authority areas.
|
Primary Fires by Location per 100,000 population for Local Authorities 2020/21 |
||||
|---|---|---|---|---|
|
Area |
Dwellings |
Other Buildings |
Road Vehicles |
Others |
|
Scotland |
85.3 |
31.4 |
33.2 |
22.3 |
|
East Dunbartonshire |
68.0 |
19.3 |
24.8 |
7.4 |
|
East Renfrewshire |
55.2 |
12.5 |
25.0 |
9.4 |
|
Glasgow |
125.1 |
37.0 |
46.9 |
12.9 |
|
North Lanarkshire |
93.2 |
31.1 |
63.6 |
12.3 |
|
Stirling |
62.7 |
40.4 |
35.1 |
35.1 |
|
West Dunbartonshire |
132.4 |
29.4 |
36.2 |
28.3 |
Source: Scottish Fire and Rescue Service Incident Statistics 2020/21
East Dunbartonshire had a lower rate of accidental dwelling and deliberate dwelling fires per 100,000 population compared to Scotland as a whole.
|
Primary Fires by Motive for Local Authorities - Rate per 100,000 population 2020/21 |
||
|---|---|---|
|
Area |
Accidental Dwelling Fires |
Deliberate Dwelling Fires |
|
Scotland |
156.0 |
19.6 |
|
East Dunbartonshire |
137.6 |
19.0 |
|
East Renfrewshire |
124.2 |
10.1 |
|
Glasgow |
216.0 |
34.7 |
|
North Lanarkshire |
177.0 |
24.7 |
|
Stirling |
114.4 |
26.2 |
|
West Dunbartonshire |
225.9 |
33.2 |
Source: Scottish Fire and Rescue Service Incident Statistics 2020/21
Health

General Health
There is limited information on the number of people who have a disability in East Dunbartonshire. The main source of data is the 2011 Census, which asked respondents to assess their own general health in order to respond to the health questions in the census questionnaire. The table below shows the general health reported by residents during the census.
- 84.9% of residents in East Dunbartonshire reported their health as being very good or good, 2% higher than the Scottish average.
- The percentage of East Dunbartonshire residents reporting their health as bad or very bad (4.3%) was lower than the Scottish average (5.6%).
|
General Health |
||||
|---|---|---|---|---|
|
Area |
All people |
Very good or good health |
Fair health |
Bad or very bad health |
|
Scotland |
5,295,403 |
82.2% |
12.2% |
5.6% |
|
East Dunbartonshire |
105,026 |
84.9% |
10.8% |
4.3% |
Source: 2011 Census
Limiting Health Problem or Disability
The 2011 Census asked people if their day-to-day activities were limited because of a health problem or disability which lasted, or was expected to last, at least 12 months, including those related to age.
- East Dunbartonshire had a high percentage of residents whose day-to-day activities were not limited by a health problem or disability (82.6%), 2% above the Scottish average.
|
Limiting Health Problem or Disability |
||||
|---|---|---|---|---|
|
Area |
Total Population |
Day to day activities limited a lot |
Day to day activities limited a little |
Day to day activities not limited |
|
Scotland |
5,295,403 |
9.6% |
10.1% |
80.4% |
|
East Dunbartonshire |
105,026 |
7.8% |
9.5% |
82.6% |
Source: 2011 Census
Teenage Pregnancies
The table below shows the rate of teenage pregnancies per 1,000 women (aged 15-19) in East Dunbartonshire has decreased from 15.66 per 1,000 women (2015 to 2017) to 13.02 per 1,000 women (2017 to 2019). The rate of teenage pregnancies per 1,000 women was considerably lower in East Dunbartonshire when compared to Scotland as a whole.
|
Teenage Pregnancy (rate per 1,000 women aged 15-19) |
|||
|---|---|---|---|
|
Area |
2015 to 2017 |
2016 to 2018 |
2017 to 2019 |
|
Scotland |
31.46 |
30.50 |
29.16 |
|
East Dunbartonshire |
15.66 |
14.74 |
13.02 |
Source: ScotPHO, relating to females aged 15-19
Provision of Unpaid Care
In the census, a person was described as a provider of unpaid care if he or she looked after or gave help or support to a family member, friend, neighbour or other person because of long-term physical or mental ill health or disability, or problems related to old age.
10.9% of residents across East Dunbartonshire provided unpaid care to relatives, friends or neighbours compared with 9.4% in Scotland. This equates to 7,223 people providing 1 to 19 hours unpaid care per week, while 2,501 provided care for over 50 hours per week.
|
Provision of Unpaid Care |
|||||
|---|---|---|---|---|---|
|
Area |
Provides no unpaid care |
Provides 1 to 19 hours unpaid care a week |
Provides 20 to 34 hours unpaid care a week |
Provides 35 to 49 hours unpaid care a week |
Provides 50 or more hours unpaid care a week |
|
Scotland |
90.7% |
5.2% |
0.9% |
0.8% |
2.5% |
|
East Dunbartonshire |
89.2% |
6.9% |
0.9% |
0.7% |
2.4% |
Source: 2011 Census
According to the 2011 Census more females than males provided unpaid care in East Dunbartonshire. The chart below shows a larger proportion of people aged 50 to 64 provided 1-19 hours of unpaid care a week compared to other age groups. This was also the case for those who provided 20 to 34 hours and 35 to 49 hours of unpaid care. Of those who provided 50 hours or more of unpaid care the majority were aged 65 and over.

Source: 2011 Census
Scottish Schools Adolescent Lifestyle and Substance Use Survey (SALSUS)
Scottish Schools Adolescent Lifestyle and Substance (SALSUS) is a national series of surveys of smoking, drinking and drug use among secondary school children. The data below provides key findings from the 2018 survey for pupils attending schools in East Dunbartonshire.
Smoking Prevalence
The findings for East Dunbartonshire in relation to smoking prevalence highlighted the following:
- 1% of 13 year olds and 5% of 15 year olds reported being regular smokers*. This is 3% lower than the 2013 survey for 15 year olds and no change for those aged 13.
- 93% of 13 year olds and 72% of 15 year olds reported they had never smoked in the 2018 survey. This was an unchanged percentage for 13 year olds and an increase of 4% for 15 year olds compared to 2013. For 13 year olds this was 6% higher than the Scottish average and 3% higher for 15 year olds.
|
Smoking Prevalence 13 and 15 year olds |
||||||
|---|---|---|---|---|---|---|
|
Smoking Status |
Never Smoked |
Regular Smokers* |
Occasional Smokers |
|||
|
Area |
13 year olds |
15 year olds |
13 year olds |
15 year olds |
13 year olds |
15 year olds |
|
Scotland |
87% |
69% |
2% |
7% |
2% |
7% |
|
East Dunbartonshire |
93% |
72% |
1% |
5% |
1% |
5% |
Source: Scottish Schools Adolescent Lifestyle and Substance Use Survey (SALSUS) 2018
*Regular smokers (smoking one or more cigarettes per week), Occasional smokers (smoke cigarettes but less than one a week)
Pupils who were regular smokers in East Dunbartonshire reported that their most common source of cigarettes was obtaining them from others by getting others to purchase them. The proportion of regular smokers who reported being given cigarettes by friends/family/carer decreased by 41% compared to 2013. The proportion of 15 year olds who reported either trying or using e-cigarettes increased by 18% compared to the 2013 survey, from 16% to 34%.
Prevalence of Alcohol Use
The results from SALSUS 2018 highlighted that the prevalence of drinking alcohol increased with age. In East Dunbartonshire, 5% of 13 year olds had drank alcohol in the week prior to the survey compared to 16% of 15 year olds.
The table below shows:
- 25% of 13 year olds and 70% of 15 year olds reported they had had an alcoholic drink, an increase of 5% for 13 and 15 year olds when compared to the 2013 survey. For 13 year olds this was 10% less than Scotland as a whole and 1% less for 15 year olds.
- 16% of 15 year old pupils reported drinking alcohol in the week before the survey.
- 44% of pupils who had ever had an alcoholic drink reported they had been drunk and 35% of 15 year old pupils who had ever had an alcoholic drink reported they had been drunk more than 10 times. This is an increase of 12% compared to the 2013 survey and 10% higher than Scotland as a whole.
|
Prevalence of Alcohol Use – 13 and 15 year olds |
||||||
|---|---|---|---|---|---|---|
|
Questions |
Thought it was ok to try drinking alcohol to see what its like |
Have had an alcoholic drink |
Had an alcoholic drink in the week before survey |
|||
|
Area |
13 year olds |
15 year olds |
13 year olds |
15 year olds |
13 year olds |
15 year olds |
|
Scotland |
51% |
79% |
35% |
71% |
6% |
19% |
|
East Dunbartonshire |
46% |
84% |
25% |
70% |
5% |
16% |
Source: Scottish Schools Adolescent Lifestyle and Substance Use Survey (SALSUS) 2018
Prevalence of Drug Use
The results of SALSUS for East Dunbartonshire shows a high proportion of pupils in East Dunbartonshire reported they had never taken drugs (94% of 13 year olds and 74% of 15 year olds).
The 2018 survey highlighted the following in terms of drug use for East Dunbartonshire secondary pupils:
- 2% of 13 year olds reported they had used drugs in the last month prior to the survey. This has remained the same since the 2013 survey.
- 22% of 15 year olds reported that they had used drugs in the year prior the survey; an increase of 1% since the 2013 survey.
- 53% of 15 year olds reported they had been offered drugs, an increase of 11% compared to the 2013 survey and 6% higher than Scotland as a whole.
- 21% of 13 year olds and 52% of 15 year olds reported that it would be ‘very’ or ‘fairly’ easy to get illegal drugs if they wanted to. This was a 9% decrease for 13 year olds and an 11% for 15 years olds since the 2013 survey. For 15 year olds this was 3% higher than the Scottish average and 2% lower for 13 year olds.
|
Prevalence of Drug Use |
||||
|---|---|---|---|---|
|
Drug experience |
Never tried drugs |
Reported using drugs in the last month |
||
|
Area |
13 year olds |
15 year olds |
13 year olds |
15 year olds |
|
Scotland |
93% |
79% |
4% |
12% |
|
East Dunbartonshire |
94% |
74% |
2% |
12% |
Source: Scottish Schools Adolescent Lifestyle and Substance Use Survey (SALSUS) 2018
Travel
The Census asked respondents to define the mode of transport used to cover the longest part, by distance, of their usual journey to work or study. Increases were seen in almost every council area in the proportion of people driving to work between 2001 and 2011.
Travel to Work or Study
- The majority of residents in East Dunbartonshire travelled to work or study by car or van (45%), just over 4% higher than the Scottish average (40.9%).
- The percentage of residents working or studying mainly from home in East Dunbartonshire (9.5%) was lower than the Scottish average (11.3%).
|
Type of Transport |
East Dunbartonshire |
Scotland |
|---|---|---|
|
Work/Study mainly from home |
9.5% |
11.3% |
|
Underground, metro light rail or tram |
0.1% |
0.3% |
|
Train |
8.2% |
3.5% |
|
Bus, minibus or coach |
10.5% |
13.4% |
|
Taxi or mini-cab |
0.9% |
0.7% |
|
Driving a car or van |
45.0% |
40.9% |
|
Passenger in a car or van |
9.3% |
9.0% |
|
Motorcycle, scooter or moped |
0.2% |
0.2% |
|
Bicycle |
0.7% |
1.3% |
|
On foot |
14.9% |
18.5% |
|
Other |
0.6% |
0.9% |
Source: 2011 Census
Distance Travelled to Work
The table below shows the distance travelled to work by people aged 16-74 in employment.
- The majority of people in East Dunbartonshire travelled between 5km and 10km to their place of work (30.1%); this was higher than the Scottish average of 17.1%.
- A small percentage of people in East Dunbartonshire travel 60km and over to their place of work (1.9%).
|
Distance Travelled to Work |
East Dunbartonshire |
Scotland |
|---|---|---|
|
Work or study mainly from home |
9.7% |
10.8% |
|
Less than 2km |
7.6% |
13.1% |
|
2km to less than 5km |
12.8% |
19.3% |
|
5km to less than 10km |
30.1% |
17.1% |
|
10km to less than 20km |
21.5% |
15.1% |
|
20km to less than 30km |
3.6% |
6.5% |
|
30km to less than 40km |
1.3% |
2.9% |
|
40km to less than 60km |
1.2% |
2.2% |
|
60km and over |
1.9% |
2.0% |
|
Other |
10.3% |
10.9% |
Source: 2011 Census
Car and Van Availability
The 2011 Census asked respondents how many cars or vans were owned, or available for use by members of the household.
East Dunbartonshire had 43.1% of households with one car or van available for use and 30.2% of households with two or more cars or vans available for use. 19% of households in East Dunbartonshire did not have access to a car or van, well below the Scottish average of 30.5%.
|
Car and Van Availability |
|||||
|---|---|---|---|---|---|
|
Area |
No Car or Van |
One Car or Van |
Two Cars or Vans |
Three Cars or Vans |
Four Cars or Vans |
|
Scotland |
30.5% |
42.2% |
21.6% |
4.3% |
1.3% |
|
East Dunbartonshire |
19.0% |
43.1% |
30.2% |
6.1% |
1.6% |
Source: 2011 Census
Railway Station Usage
Passenger rail usage during 2020/21 was affected by the COVID-19 pandemic. Scotland, Wales and all nine regions in England recorded substantial falls in journeys in 2020/21, which was driven by measures to limit the spread of the pandemic. This chart below shows substantial decreases in rail usage for all six stations in East Dunbartonshire during 2020/21.

Source: Office of Rail and Road, 2020/21 Estimates of Station Usage
Scottish Index of Multiple Deprivation 2020
Background
The Scottish Index of Multiple Deprivation (SIMD) is the official measure of deprivation in Scotland and identifies small area concentrations of multiple deprivation. The Index provides a relative measure of deprivation and is used to compare small areas (datazones) across Scotland by providing each zone with a unique ranking from most deprived (Rank 1) to least deprived (Rank 6,976). Further information on SIMD can be accessed on the Scottish government website.
Datazones are a commonly used geography across Scotland and are determined by population rather than size, therefore urban datazones have a smaller geographical area than rural datazones. The average datazone has a population of 760 people. There are currently 130 datazones within East Dunbartonshire.
For an in depth look at statistics for each datazone visit our SIMD interactive dashboard [opens in a new window].
Methodology
Scotland is split into 6,976 small areas called datazones with roughly equal populations. Indicators to measure the different sides of deprivation in each datazone are looked at, like pupil performance, travel times to GP, crime, unemployment and many others. These 38 indicators of deprivation are grouped into seven types, called domains. The seven domains (shown in the table below) are combined into one SIMD, ranking each datazone from one (most deprived) to 6,976 (least deprived). This provides a measure of relative deprivation at datazone level and shows that one datazone is relatively more deprived than another but not how much more deprived.
|
SIMD Domain |
Related Indicators |
|---|---|
|
Income |
Percentage of people who are income deprived and receive certain benefits |
|
Health |
Hospital stays related to alcohol and drug misuse, standardised mortality ration, emergency stays in hospital, proportion of population prescribed drugs for anxiety, depression or psychosis, proportion of live singleton births at low birth weight, comparative illness factor. |
|
Employment |
Percentage of working age people who are employment deprived and receive certain benefits |
|
Education |
School pupil attendance, attainment of school leavers, working age people with no qualifications, proportion of people aged 16-19 not in full time education, employment or training, proportion of 17-21 year olds entering into full time education |
|
Housing |
Percentage of people living in households that are overcrowded, percentage of people living in households with no central heating |
|
Access to Services |
Average drive time to a petrol station, GP surgery, post office, primary school, secondary school and retail centre Public transport travel time to a GP surgery, post office and retail centre |
|
Crime |
Recorded crimes of violence, sexual offences, domestic housebreaking, vandalism, drugs offences and common assault per 10,000 people |
SIMD can be analysed by looking at datazones below a certain rank, such as the 10%, 15% or 25% most deprived datazones in Scotland. For example, deciles split up Scotland’s datazones into ten groups, each containing 10% of them. Datazones ranked between one and 697 (the first decile) are the 10% most deprived datazones in Scotland.
While the SIMD measures concentrations of deprivation, it is not a measure of relative affluence and should not be used as such. For example, it would be incorrect to say the datazone ranked 6,976 is the most affluent in Scotland but it can be stated that it is the least deprived. Although the SIMD identifies areas with deprivation it does not mean that everyone living in the area is deprived, likewise there may be deprived people living in areas that are not deprived according to SIMD.
Key Findings
East Dunbartonshire remains relatively less deprived in contrast to other Scottish local authorities with the majority of East Dunbartonshire datazones falling into the least deprived areas of the SIMD. Although East Dunbartonshire, as a whole, is relatively less deprived than other local authorities in Scotland, there are specific areas within East Dunbartonshire that fall below the Scottish average.
East Dunbartonshire has eight datazones in the most deprived 25% in Scotland. These are located in Hillhead, Auchinairn, Lennoxtown, Kirkintilloch West and Keystone and Dougalston in Milngavie. Hillhead remains the most deprived area in East Dunbartonshire according to SIMD. The datazone in Keystone and Dougalstone in Milngavie has entered the top 25% most deprived. Of the individual domains East Dunbartonshire has the most deprived datazones in the access domain which would be expected given the rural nature of certain parts of the authority.
East Dunbartonshire Datazones in the most deprived 25% in Scotland
|
Datazone |
Intermediate Area |
2020 Rank |
2020 Decile |
2016 Rank |
Decile 2016 |
Improvement |
|---|---|---|---|---|---|---|
|
S01008137 |
Hillhead |
193 |
1 |
458 |
1 |
|
|
S01008159 |
Lennoxtown |
604 |
1 |
1,202 |
2 |
|
|
S01008139 |
Hillhead* |
654 |
1 |
1,373 |
2 |
|
|
S01008138 |
Hillhead |
770 |
2 |
740 |
2 |
|
|
S01008131 |
Kirkintilloch West |
1307 |
2 |
1,149 |
2 |
|
|
S01008106 |
Auchinairn |
1564 |
3 |
1,157 |
2 |
|
|
S01008103 |
Auchinairn |
1605 |
3 |
2,038 |
3 |
|
|
S01008046 |
Keystone and Dougalston |
1723 |
3 |
1,982 |
3 |
|


Further Information
Information is available at smaller geography levels and further analysis of the statistics found in this document can be provided on request by contacting the Corporate Performance and Research Team.
Corporate Performance & Research Team
East Dunbartonshire Council
12 Strathkelvin Place
Kirkintilloch
G66 1TJ
Tel: 0300 123 4510
Email: ppr@eastdunbarton.gov.uk
All released census data can be found on the Scotland’s Census website