
Technical Notes 2023, Issue 40 - Waste Compositional Analysis
Section
- The purpose of this technical note is to advise Members of the findings of the recent waste compositional analysis, completed November 2022.
- The Council secured Zero Waste Scotland funding to complete a waste compositional analysis of the authority’s household waste. Alfred Knight was commissioned to carry out the work, and the study was completed between 31st October and 11th November 2022.
- There were 250 household general waste bins analysed during the study. The study was representative of the whole authority area, with sample bins being carefully selected from various pre-categorised locations. The analysis was completed using Zero Waste Scotland methodology.
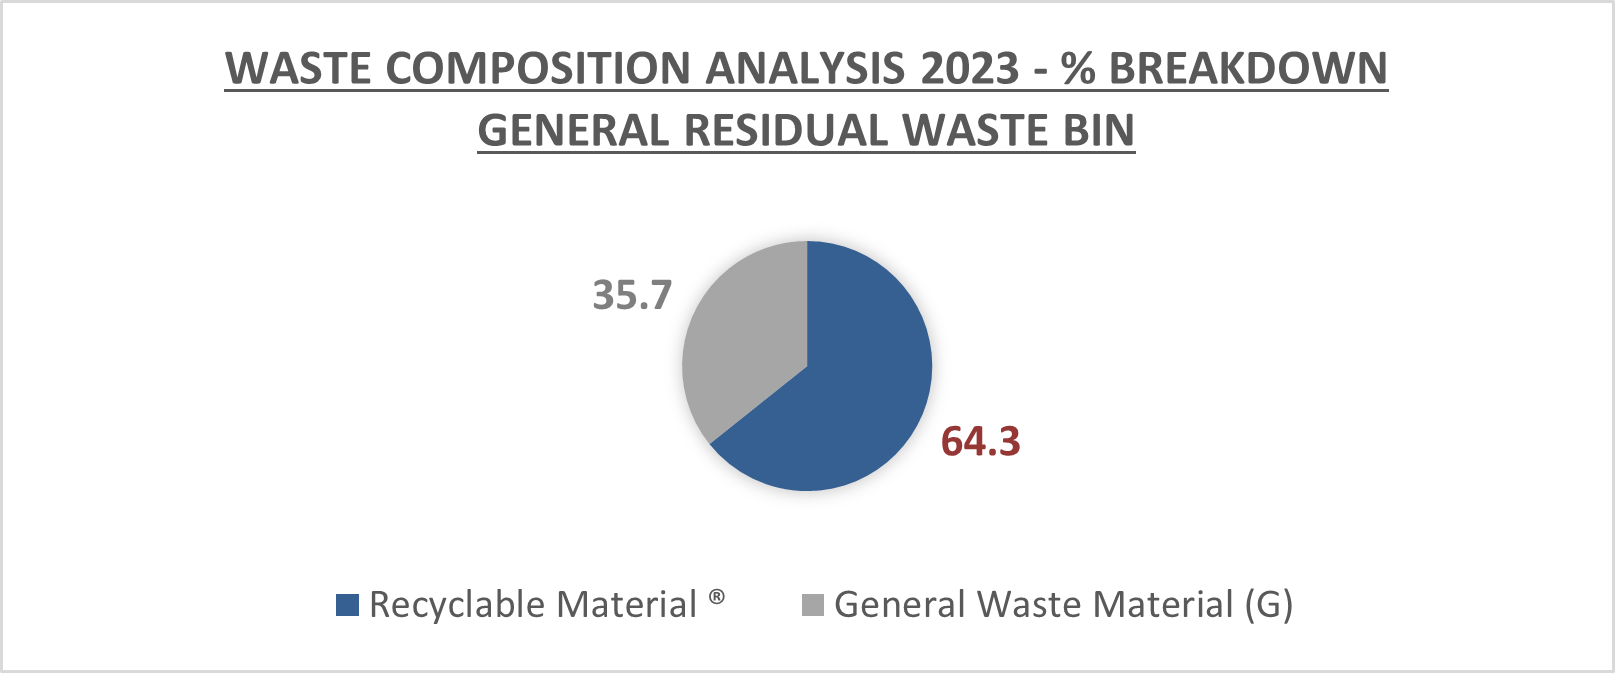
- The summary of findings identified 35.7% of the general waste bin was made up of general waste, and 64.3% was made up of material with recycling routes available within the authority.
5. There was a further breakdown completed to identify the individual waste streams of both the recycling and general waste materials within the general waste bin.
COMPOSITION OF GENERAL WASTE BIN | |||||
|---|---|---|---|---|---|
| Recyclable materials | General waste | |||
% | kg/hh/wk | % | kg/hh/wk | ||
1 | Glass waste | 3.1% | 0.27 | 0.2% | 0.02 |
2 | Paper | 1.3% | 0.11 | 6.5% | 0.56 |
3 | Cardboard | 3.4% | 0.29 | 1.8% | 0.16 |
4 | Metal | 4.1% | 0.35 | 0.0% | 0.00 |
5 | Dense plastic | 5.5% | 0.47 | 1.6% | 0.14 |
6 | Plastic films and flexibles | 4.6% | 0.40 | 2.1% | 0.18 |
7 | Garden waste | 3.1% | 0.26 | 0.0% | 0.00 |
8 | Food wastes | 30.8% | 2.65 | 0.0% | 0.00 |
9 | Wood | 0.6% | 0.05 | 0.0% | 0.00 |
10 | Electrical and electronic items | 1.4% | 0.12 | 0.0% | 0.00 |
11 | Textiles | 6.4% | 0.55 | 0.3% | 0.03 |
12 | Absorbent hygiene products | 0.0% | 0.00 | 9.7% | 0.83 |
13 | Other | 0.0% | 0.00 | 11.5% | 0.99 |
14 | Unclassified | 0.0% | 0.00 | 1.8% | 0.16 |
TOTAL | 64.3% | 5.52 | 35.7% | 3.07 | |
6. The breakdown clearly identifies the high percentage of 30.8% of food waste continuing to enter the general waste stream. This food waste category includes all forms of food waste i.e. packaged, non packaged, oils and liquids contained within bottles.
7. The study also identified that from the 250 bins/properties that formed the general waste analysis, the participation in recycling was 81% for the blue paper/card recycling bins and 80% for the brown recycling bin accepting cans, glass and plastics.
8. The Waste Service team are engaging with Corporate Communications to utilise the findings of the study to drive campaigns in the months ahead. Work has already commenced with food waste, with a focus on increasing participation in the kerbside collection.