
Communication and Engagement Annual Overview 2024/2025
Introduction and Background
Highlights
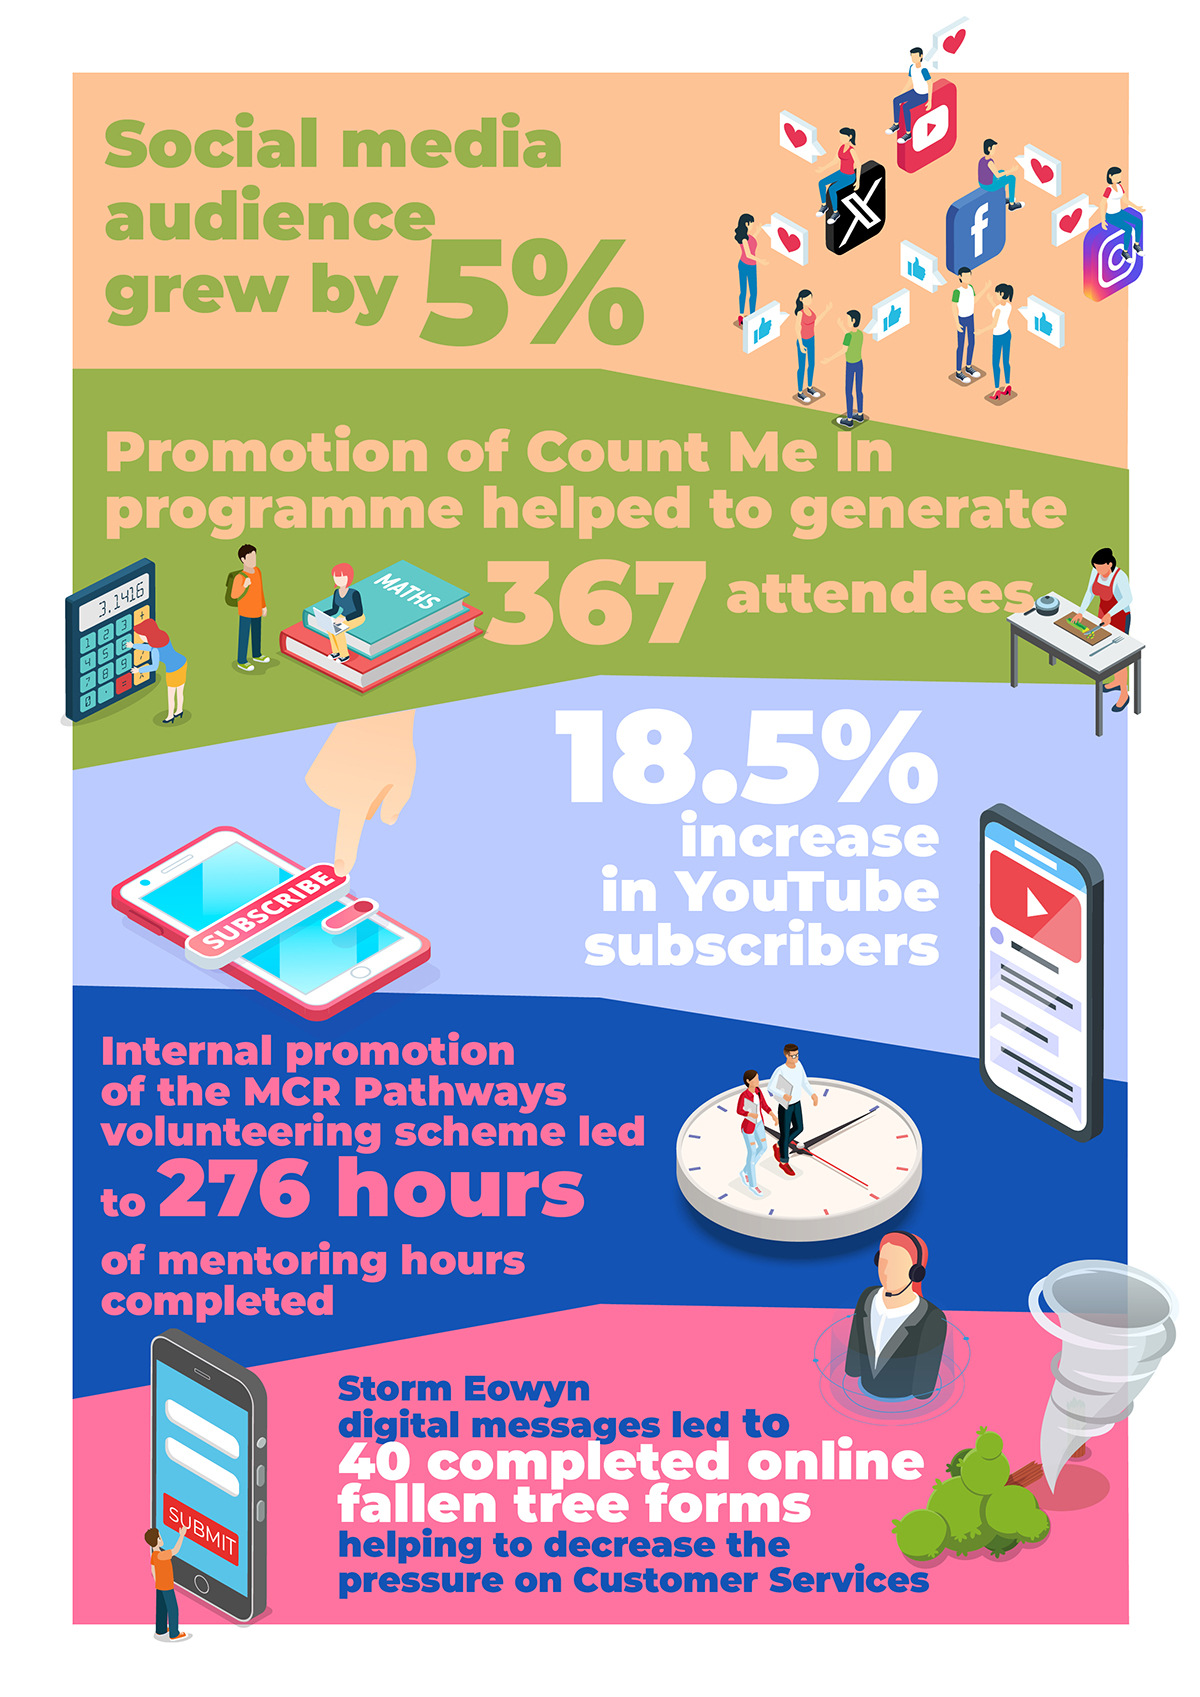 Click image to enlarge.
This report provides an overview of Communications and Engagement performance during financial year 2024/25.
It includes statistics and data from across our communications channels as well as an in depth, analytical look into our social media channels and audience, that can be found in the Appendix to this Annual Overview.
Background
The Communications and Engagement team provide communications support and guidance across the organisation to manage reputation and ensure key audiences –internal and external - are aware of service delivery, developments and key decisions.
The team supports all service areas within the organisation by ensuring the delivery of essential messages to target audiences across a variety of relevant channels, and in facilitating effective and co-ordinated consultation and engagement. The Communications and Engagement team also support East Dunbartonshire Health and Social Care Partnership, East Dunbartonshire Leisure and Culture Trust, and provides expertise, support and guidance to all Council schools.
Priorities in 2024/25 included delivering comprehensive communication activity for the UK General Election and Local Government By-election, changes to Waste services, the Scotland Loves Local gift card, Kirkintilloch Canal Festival, Storm Eowyn, City Deal and Civic Office, as well as the launch of the new Council and HSCP websites.
Key areas include:
- Reputation management and Crisis Communications
- Engagement with regional and national resilience networks
- Digital communications (social media and website)
- Media Relations
- Internal communication and employee engagement
- Design
- Consultation and Engagement
- Accessibility.
Communications Planning
Effective communications planning supports the Council’s strategic priorities and ensures messages are conveyed in a timely manner to our target audiences. It aims to achieve public understanding of these, new projects, and service delivery plans including any changes to be implemented. It also raises awareness of positive projects across the area aimed at improving or introducing initiatives for the benefit of the communities we work in. Communications planning also encourages positive calls to action for campaigns, events and consultation activity.
The Communications and Engagement team support Council and Service Committees ensuring decisions are effectively communicated to residents. This includes reviewing Council and Committee reports, engaging with Conveners and lead officers, and effectively promoting decisions and developments online and through appropriate media networks.
Communications Plans are prepared for all key Council delivery and developments, including projects within the capital programme, changes to services/delivery and key initiatives in support of the Council’s priorities aimed at residents and/or employees. Plans include both external and internal communications requirements and online and offline activity.
Media Management
Media relations is still an important tool for reputational management, and for advising residents and businesses in the local area of service updates and campaigns.
During 2024/25, a total of 112 press releases were issued, 51 photocalls organised and 284 media enquiries responded to. Media enquires in 2024/25 increased from the year before and all responses to these enquiries met the deadlines set by the journalist.
The team continues to engage with local, regional and national news outlets for both proactive and reactive media activity. The local media coverage (Kirkintilloch Herald and Milngavie and Bearsden Herald) achieved from those proactive releases equated to a total of £77,968 if the Council had purchased that coverage through advertising. The news section of the new website has received 44,539 views from November 2024, when the new site launched, to March 2025 which on average is over 2,200 views per week.
Table 1. Media Activity 2024/25
| Month | No. of media enquiries | Photocalls | No. of media releases | Advertising equivalent of local coverage (£) |
|---|---|---|---|---|
|
April 2024 |
24 |
4 |
17 |
5,372 |
|
May 2024 |
29 |
5 |
12 |
8,136 |
|
June 2024 |
17 |
0 |
9 |
4,100 |
|
July 2024 |
30 |
5 |
6 |
4,986 |
|
August 2024 |
10 |
8 |
14 |
8,568 |
|
September 2024 |
24 |
2 |
4 |
8,904 |
|
October 2024 |
29 |
8 |
8 |
7,790 |
|
November 2024 |
22 |
8 |
15 |
5,356 |
|
December 2024 |
12 |
2 |
8 |
5,152 |
|
January 2025 |
25 |
2 |
3 |
6,144 |
|
February 2025 |
37 |
2 |
8 |
4,320 |
|
March 2025 |
34 |
5 |
8 |
9,140 |
|
Total |
293 |
51 |
112 |
77,968 |
|
2023/2024 Total comparison |
208 |
58 |
157 |
71,496 |
Social Media Management
The Council’s social media accounts – Facebook, X, LinkedIn, Instagram and YouTube – are key communication channels allowing us to ensure our messaging is seen by thousands of residents. As well as those residents that follow us, our posts are consistently shared by local community groups, local organisations and businesses and Community Council’s which amplifies the messaging. Despite changes to algorithms important metrics including engagement and click throughs to the Council website all continue to perform well.
The Communications and Engagement team manage these channels through a social media management tool which retains an audit trail of who posts to the accounts and when. It enables the team to schedule posts at appropriate times of day and provides analytics on each channel. More on this tool can be found in Appendix 1.
Facebook and X continue to be the most popular and effective social media channels to share information on important updates, service delivery, key projects, initiatives and campaigns. This was particularly evident during Storm Eowyn which led to over 100 new followers on X in under 24 hours. LinkedIn, Instagram and YouTube continue to grow and become more influential and impactful. All channels are used to encourage participation in consultation and engagement activity when relevant.
Summary Of Social Media Channels
By the end of 2024/2025, our Facebook channel had 25,809 followers, an increase of 1,782 on the year before. Facebook also results in the most traffic to our website of any of our social media channels with just under 70,000 views coming directly from Facebook posts.
X
While changes to the platform have led to a decrease in users, by the end of the year our channel had 20,268 followers, a drop of only 428.
Content posted on LinkedIn has a particular focus on capital programme projects, recruitment and economic development initiatives in order to engage with stakeholders, partners, residents and employees, By the end of the year there were 4,305 followers, an increase of 16% on last year.
This channel continued to grow with an emphasis on engaging photography and graphics. By the end of the year followers had increased to 1,183, a 55% increase on last year.
YouTube
A key objective for the Communications and Engagement team was to increase subscribers to the Council’s YouTube channel. The target was 7% but results show a 19% increase achieved. The channel now has 721 subscribers.
Social Media Metrics
Table 2 below outlines the main performance indicators used to measure the performance of social media channels. Compared to 2024/2025 our audience size rose by 2,366 or 5%. Our amplification rate is down on last year as a result of changes to X and our click throughs decreased as all social media platforms made changes to their algorithms to discourage use of links.
Table 2. Key Social Media metrics 2023/24
| Category | X | |||
|---|---|---|---|---|
|
Impressions |
6,036,248 |
868,542 |
120,637 |
67,149 |
|
Audience Size |
25,809 |
20,268 |
4,305 |
1,183 |
|
Amplification rate (shares) |
6,239 |
540 |
29 |
28 |
|
Click throughs |
68,191 |
9,040 |
5,404 |
163 |
The totals for the above table are:
Impressions: 7,092,576
Audience Size: 51,570
Amplification rate (shares): 6,836
Click throughs: 82,798
Table 3 to Table 6 below provide a breakdown of the key metrics by Quarter. This highlights the regularity and consistency in which residents engage with our social media channels throughout the year. Even during traditional ‘quieter’ periods such as school holidays and Christmas and New Year holidays our posts perform well. This data is used to make decisions around timing and effectiveness of messaging.
Table 3. Q1 2024/25
| Category | X | |||
|---|---|---|---|---|
|
Impressions |
1,681,154 |
270,009 |
43,806 |
11,791 |
|
Audience size |
24,301 |
20,615 |
3,894 |
850 |
|
Amplification rate |
1,526 |
204 |
83 |
0 |
|
Click throughs |
18,245 |
2,430 |
451 |
27 |
The totals for the above table are:
Impressions: 2,006,760
Audience size: 49,660
Amplification rate: 1,813
Click throughs: 21,153
Table 4. Q2 2024/25
| Category | X | |||
|---|---|---|---|---|
|
Impressions |
1,387,102 |
196,719 |
31,048 |
12,052 |
|
Audience size |
24,557 |
20,515 |
4,033 |
905 |
|
Amplification rate |
1,524 |
175 |
3 |
0 |
|
Click throughs |
12,619 |
2,343 |
2,064 |
9 |
The totals for the above table are:
Impressions: 1,626,921
Audience size: 50,010
Amplification rate: 1,702
Click throughs: 17,035
Table 5. Q3 2024/25
| Category | X | |||
|---|---|---|---|---|
|
Impressions |
1,202,120 |
159,822 |
24,262 |
13,580 |
|
Audience size |
24,925 |
20,290 |
4,139 |
964 |
|
Amplification rate |
1,023 |
143 |
14 |
7 |
|
Click throughs |
10,071 |
1,559 |
1,684 |
7 |
The totals for the above table are:
Impressions: 1,399,784
Audience size: 50,318
Amplification rate: 1,187
Click throughs: 13,321
Table 6. Q4 2024/2025
| Category | X | |||
|---|---|---|---|---|
|
Impressions |
1,765,872 |
241,992 |
21,521 |
29,726 |
|
Audience size |
25,809 |
20,268 |
4,305 |
1,188 |
|
Amplification rate |
2,166 |
139 |
9 |
21 |
|
Click throughs |
27,256 |
2,708 |
1,205 |
120 |
The totals for the above table are:
Impressions: 2,059,111
Audience size: 51,570
Amplification rate: 2,335
Click throughs: 27,253
Most popular posts
The top three most seen posts on Facebook were:
- A change to general waste collection is coming - 64,042 impressions / 582 reactions / 844 comments / 171 shares / 1,720 clicks
- Set your compass for East Dunbartonshire – the dates have been confirmed for the 2024 Kirkintilloch Canal Festival - 50,461 impressions / 240 reactions / 56 comments / 54 shares / 86 link clicks
- You can now apply for your garden waste permits for 2025 green bin collections - 49,057 impressions / 54 reactions / 168 comments / 44 shares / 1,998 link clicks
The top three on X were:
- A new community sports facility will soon be available to local groups. A lease of the Kirkintilloch Community Sports Complex has been concluded - 23,388 impressions / 12 likes / 0 comments / 12 retweets / 316 link clicks
- Red weather warning issued for East Dunbartonshire - 12,188 impressions / 38 likes / 5 comments / 28 retweets
- The Ward 7 by-election results are in - 11,893 impressions / 18 likes / 3 comments / 18 retweets / 659 link clicks
The most popular post on LinkedIn was relating to Twechar Outdoor Pursuits Centre while on Instagram it was about the changes to the general waste service.
Further positive news relating to Woodland View School, Early Years recruitment, Provost’s Community Champion Awards were popular with residents.
Website Analysis
The Council website is a crucial communication channel for the Council. As well as providing important information it allows residents to carry out a range of tasks online in line with the Council’s Click, Call, Come In approach to customer service delivery.
In 2024/25 there was a total of 2,930,949 website visits with 4,362,429 page views as indicated in Table 7 below.
Table 7
| Visits | 2023/24 | 2024/25 |
|---|---|---|
|
Overall Visits |
1,610,532 |
2,930,949 |
|
Page Visits |
2,782,293 |
4,362,429 |
While visitor traffic remained consistent throughout the year, after launching the new Council website in October 2024, (for more see case study below) and announcing changes to service delivery particularly in Waste website visits and page views increased significantly in Quarter four. The information available on our website alongside our social media messaging means we are reaching more residents than ever online.
Table 8. Visitors by Device
| Devices | Total Visits | Percentage |
|---|---|---|
|
Mobile |
1,590,191 |
61.5 |
|
Desktop/ Laptop |
902,697 |
34.9 |
|
Tablet |
92,518 |
3.6 |
Table 8 (above) highlights that most visitors to the Council website use a mobile phone rather than a desktop/laptop computer to visit the website. The figures show that there was a slight increase of 1.6% in mobile usage taking the figure from 59.9% to 61.5%. The new Council website was built as ‘mobile friendly first’ as a result of this data as well as global trends.
Traffic Sources to the Council Website
Most visitors to the website use Search engines to find the information they need with over 831,000 visits made in this way. Direct traffic is the second most popular traffic source, with over 300,000 visits, meaning visitors know the web address and use it directly.
Most Popular Website Pages
The most popular page on the Council website is School Holidays. The majority of the top ten are related to Waste – this is mainly due to changes to the general waste collections and introduction of a garden waste permit.
Table 9 below summarises the page views and page visits for the top ten pages on the Council website. Views is defined by the total number of times a page is looked at, whilst Visits is when someone goes to the webpage and then looks at more than one page.
Table 9. Top ten most popular pages
| Webpage | Page views | % of total views | Visits | % of total visits |
|---|---|---|---|---|
|
School holidays |
278,393 |
7.6 |
160,613 |
10.5 |
|
Bins and recycling |
197,021 |
5.3 |
190,872 |
5.8 |
|
Bins, Waste and Recycling |
139,953 |
3.8 |
135,764 |
6.8 |
|
Household waste and recycling centres (tips/dumps) |
222,218 |
6 |
215,672 |
8.3 |
|
Garden waste collection |
119,949 |
3.3 |
79,241 |
4.6 |
|
Make a payment |
70,115 |
1.9 |
60,153 |
2.3 |
|
Planning Applications Search |
50,538 |
2.1 |
49,090 |
1.9 |
|
Changes to General (grey) bin collections |
29,502 |
0.8 |
29,068 |
1.1 |
|
Contact Us |
25,629 |
0.7 |
25,077 |
1.0 |
|
News |
22,297 |
0.6 |
23,949 |
0.9 |
The Communications & Engagement team also maintain and update both the East Dunbartonshire Health & Social Care Partnership (HSCP) website and the East Dunbartonshire Leisure & Culture Trust (EDLC) website. This centralised service also provides support to all East Dunbartonshire schools by maintaining and regularly updating their websites.
Design
Design remains an essential tool and allows us to tell the Council’s story in a way that is eye catching, informative and engaging. It also supports global digital trends as more and more people prefer using video output to learn and digest information. This has led to social media channels making subtle changes to their platforms to prioritise video content.
The Council’s design service had 690 jobs in 2024/25, an increase of 90 on the year before. These were a mix of posters, signage, social media graphics, documents and video. Video creation continued to rise increasing by 20% this year.
The top two most watched videos on YouTube were ‘UK General Election 2024 – what to expect at the polling station’ - 41.2 hours viewed / 1,676 video views and ‘New era kicks off – Kirkintilloch Sports Complex’ - 19.3 hours viewed / 1,230 video views. The top videos on Facebook were ‘Woodland View splash pool’ - 4,230 mins viewed / 16,060 video views and ‘Etive track pump track officially opens’ - 3,767 mins viewed / 937 video views.
Other videos created to promote key projects, services and campaigns included gritting, primary school registration, budget and playparks openings.
On Facebook there were 58,746 minutes of videos viewed.
Currently, there are 721 subscribers to the official East Dunbartonshire Council YouTube channel and in 2023/24 there were 72,992 views of our videos resulting in 1,977.7 hours watched.
Campaigns
Campaigns are a crucial tool for the Council. Not only do they raise awareness and encourage call to action and behavioural change, but they also help to build reputation and loyalty.
A number of campaigns varying in size took place in 2024/25 including call to action drives encouraging applications to the Community Grant Scheme and attracting participants for Count Me In and awareness raising changes to Waste services and the UK General Election. For the latter, an online and offline campaign to inform residents of the changes to voting in the General Election was implemented.
The results showed that voters in Mid Dunbartonshire were aware of the changes to Voter ID and Postal Votes via a number of ways, and the figures showed the real-life consequences of this with a voter turnout of 71.8% and 88.3% of postal votes cast.
Messages supporting national awareness campaigns and lighting of Council buildings for causes including Parkinsons, Pancreatic Cancer, 16 Days Against Gender Based Violence and Epilepsy also play an important role.
Going forward, a strategic approach will be taken when supporting national awareness campaigns.These will be promoted through relevant Council and HSCP channels, with an emphasis on local activities and initiatives that support the national messaging.
Internal Communications
Internal Communications are essential in ensuring relevant organisational updates are received by the Council’s workforce in a timely manner.
Internal Communications are planned alongside change projects, with communications plans in place in line with project timescales. Established tools such as Leadership Information Packs, Employee News and All User Emails remain in place.
In 2024/25 a total of 46 Employee News were issued, compared to 36 in 2023/24. As well as being emailed to those on the Council network, they are also published to the Employee Zone of the Council website so that line managers and colleagues can share with those who are not on the network.
Regular updates to the whole workforce, including a roundup of the key achievements, news issues and Council decisions are delivered monthly through the Chief Executive’s Update (CE update). As with Employee News, these are all published to the Employee Zone of the Council website. Additional CE updates are also issued when relevant in relation to a specific issue such as Storm Eowyn.
The project to replace the Council’s intranet continued with an audit of the existing intranet The Hub. The findings will support the next phase of the project.
Consultation and Engagement
The Communications and Engagement team supports all Council services in the implementation and delivery of the Consultation and Engagement Strategy. This includes statutory and non-statutory consultations and community engagement. In line with the principles of ‘we asked, you said, we did’ the Communications & Engagement team support services in the planning and promotion (we asked) of the consultation and post consultation reporting to ensure the results (you said) and findings/actions (we did) are effectively communicated.
Services are asked to include planned consultation activity in their Business and Improvement Plans (BIPs) so an action plan can be produced each year.
The plan allows the Communications and Engagement team to effectively plan and promote the delivery of consultation activity. Working with services, the team offers guidance and expertise, prepares and creates surveys, develop webpages and plans effective promotion to the target audience. The Action Plan allows timescales to be explored and potential clashes to be avoided. Ultimately the plan and subsequent work is aimed at encouraging participation.
In 2024/25 the team supported services across the Council with 22 consultations and HSCP with four.
Topics included Westerhill Development Road, Local Heat and Energy Efficiency Strategy, Affordable Housing Provision, Glazert Water Restoration Project, British Sign Language and the 2023/2025 Council Budget.
A full list can be found within the Consultation section of the website.
Once a consultation closes, results and data are sent to the service to analyse. Thank you and update messages to the relevant audience are posted on the appropriate webpage and posted on social media. A post consultation report detailing online engagement and other key statistics is also completed and sent to the service for information. Once the service is in the position to publish its findings and/or the report that was guided by the consultation, the Communications and Engagement team ensure this is available on the website and subsequent promotion is carried out.
Case Study – New Council Website project
The project to replace the Council website is an example of successful and effective internal cross-team and external supplier, collaboration and working.
The overarching ambition of the project was to improve the customer experience. This would ultimately be achieved by developing a new citizen-centric website that encouraged the use of digital services, had an improved search functionality, ensured a smooth customer journey and adhered to accessibility standards.
By undertaking research, user testing and design workshops to develop the site structure and design of the site, the new site was launched on 31 October 2024 - the result is a modern, mobile friendly, accessible, dynamic Council website.
Objectives of the project
- Ambition – To improve the customer experience of our online services
- Structure – Provide a smooth customer journey
- Citizen centric – Based on customer expectations and not internal structures
- Consistent – Format and presentation
- Accessible – Building in accessibility from the beginning
- Transactional – Encouraging people to self-service.
Planning Stage
After a robust Procurement exercise in which website developers Bright Signals were secured, we carried out a combination of various methods of research including:
- Desk Research to understand the existing website structure and dependencies and to identify clear and key areas of improvement
- Design session to inform the style and functionality needed
- A user needs workshops to identify key users, organising them into Primary, Secondary and Tertiary users
- A card sort where multiple teams within the Council formed groups and worked independently on the entire website structure, with a focus on creating a whole new structure (and naming conventions) by putting themselves in the minds of the citizen.
This allowed us to create a proposed site structure however we first wanted to test our hypothesis against real end-users. A cross section of the community volunteered to carry out a task called ‘tree testing.’ The overall success rate of the study was 64%, meaning that 64% of the participants ended up at the correct destination, which is an extremely positive result. The analysis of the results concluded that we should make some changes to the sitemap.
Design
The visual prototype brought together everything that was learned to date. The design agreed was clear, clean and a modern take on the Council’s branding. It is spacious for mobile use and includes homepage functionality for tactical messaging and data driven quick links.
Accessibility
We wanted an exemplarily focus on accessibility and inclusivity to ensure all users have access to information and services provided on our website.
Public Sector (Website and Mobile Applications) Regulations require Councils to ensure that their websites, social media channels and any apps they develop are fully accessible to all.
To ensure accessibility was built into the new Council and HSCP websites from the start, we worked with The Shaw Trust to provide expertise testing at crucial stages of the project.
The work completed by The Shaw Trust had four key stages:
- Early feedback on visual design prototype
- Analysis and testing of the test site
- Further analysis and testing of the test site once previous recommendations were implemented
- Full testing of the live site resulting in full accreditation gained.
The accessibility of both the development and content of the website improved due to this work with The Shaw Trust. Accessibility issues on our new website decreased by 94% compared to our last test in February 2023. Once these 51 issues were solved, we achieved full accreditation from The Shaw Trust.
Results
We successfully launched the new Council website on 31 October with the below aims achieved:
- Improved system efficiency – more flexibility with page types and content management allowing the Communications & Engagement team to manage and adapt information
- Improved functionality for key external stakeholders – a second round of Tree Testing’ with the same users as at the beginning of the project resulted in a customer journey success rate of 87% (an increase from 64%)
- Improved customer accessibility – WCAG 2.2 accreditation achieved
- Increased use of new functionality such as call to action buttons which had over 45,000 clicks.
Conclusion
The Council website is a key communication channel for the Council and complements the new Customer Relationship Management (CRM) system to further encourage and support residents to access services online. The Communications & Engagement team will continue to ensure timely updating and further development of the site, using improved data via Google Analytics 4, customer feedback and accessibility testing to ensure the objectives of the project continue to be met.
Highlights and Next Steps
The Communications & Engagement team will continue to support all communications and engagement requirements for the Council through effective communications planning, reputation management, media management, social media management, internal communications, campaigns and design work and consultation & engagement activity.
The key focus for the team for 2025/2026 will include effective communication plans for projects within the capital programme, increased video creation promoting digital services, creation and implementation of a new internal comms strategy and action plan including the replacement intranet project as well as support for the Civic Office, City Deal and the exploration of new channels and in the relevance/effectiveness in reaching our target audience.
Appendix 2 – Social Media Analysis
East Dunbartonshire Council’s Social Media Strategy 2022 – 2026 sets out the Council’s approach to social media and defines it use, management and purpose.
Since the Council’s social media accounts were first launched in 2012, platforms and audience behaviour have changed significantly.
The latest data shows that 83% of the total UK population use social media, equating to 56 million users. Social media usage continues to rise, with UK users expected to hit 65 million by 2027. However, the biggest change from the early days of social media, is that individuals will now access multiple platforms, preferring to use each one for different reasons and to engage with content that aligns with specific interests and increasingly, their values.
With such significant numbers present on these channels, it’s essential that the Council has a robust social media strategy and action plan, in order to be fully active, and to continue to engage, in the spaces our target audience are in. This allows us direct access to listen to what our communities are telling us, monitor interactions and communicate important messages all in real time.
Currently the Council has four social media channels as well as YouTube.
- Facebook - 25,809 followers
- X - 20,268 followers
- LinkedIn - 4,305 followers
- Instagram - 1,183 followers
In 2024/25 we increased our overall followers by just under 5%. Facebook is our most popular channel with followers continuing to increase year on year. Specific work aimed at Instagram and LinkedIn since 2023 has led to significant growth on each.
Social Media 2023/24 Audience Size
| Total | ||||
|---|---|---|---|---|
|
24,027 |
20,696 |
3,720 |
761 |
49,204 |
Social Media 2024/25 Audience Size
| Total | ||||
|---|---|---|---|---|
|
25,809 |
20,268 |
4,305 |
1,183 |
51,570 |
The Communications and Engagement team manage these channels through a social media management tool, Orlo, which retains an audit trail of who posts to the accounts and when. It enables the team to schedule posts at appropriate times of day and provides analytics on each channel.
As well as this Orlo allows us to:
- Identify sentiment of channels as well as individual posts
- Tag posts to create analytics based on topics, services and content type
- Benchmark against other organisations and brands
- Access Insights to uncover emerging trends, levels of trust and public sentiment
- Access comprehensive analytics to make data driven decisions.
The key metrics that we track mainly relate to engagement and ultimately the effectiveness of our messages reaching our residents.
These metrics evidence that that our audience are accessing the information, are engaged in our messaging and that our content relates directly to them.
Key results for 2024/25 that support this:
- An impressions figure of 7,092,576. Impressions are the total number of times a piece of content is displayed to users, regardless of whether they interact with it
- Click throughs to our website – 82,798 (95% of these came from the UK) the real figure will be higher as this doesn’t include various privacy settings, use of VPNs (Virtual Private Networks) and users not accepting Cookies
- Engagement rate of over 1.4% on each channel (industry standards indicate a good engagement rate is 0.5, anything above 1 is deemed great). Facebook; 1.54%, X; 1.41%, LinkedIn; 2.77%, Instagram; 1.87%
- Overall shares of over 7,000 which helps to amplify our messaging across East Dunbartonshire. An exploration of the shares show that these are by residents, Community Council’s and community groups
- A positive/semi positive sentiment rating of 36%.
The sentiment tool allows us to see the nature of the comments and reactions our content is receiving.
Overall Sentiment
Positive: 17.4%
Semi-positive: 18.6%
Neutral: 33.3%
Semi-negative: 24.4%
Negative: 6.3%
Facebook sentiment
Positive: 13.1%
Semi-positive: 17.6%
Neutral: 36.5%
Semi-negative: 26.3%
Negative: 6.5%
X Sentiment
Positive: 23.5%
Semi-positive: 22.9%
Neutral: 26.2%
Semi-negative: 21.0%
Negative: 6.3%
Instagram sentiment
Positive: 47.2%
Semi-positive: 14.2%
Neutral: 22.3%
Semi-negative: 11.3%
Negative: 5.0%
LinkedIn sentiment
Positive: 69.0%
Semi-positive: 17.6%
Neutral: 7.8%
Semi-negative: 4.9%
Negative: 0.8%
Our strategic approach to both LinkedIn and Instagram content has led us to understand what content works best on those channels which in turn has fostered a higher positive sentiment. This can be replicated in part on Facebook and X to ensure we’re using each channel in the most effective way to reach our target audience.
It must also be noted that X and Facebook are invaluable tools when it comes to crisis communications which was evident during Storm Eowyn. We gained over 140 new X followers in one day and we were able to direct residents on both channels to report fallen trees via online forms instead of calling Customer Services. This resulted in over 40 online forms submissions on the day.
Our Audiences
We can access detailed demographical information on our Facebook audience, however X introduced a payment for this data, so we are unable to look into this audience in the same detail. We can see however that 93% of the click throughs to our website via X are from the UK.
On LinkedIn 66.7% of our followers are in the Greater Glasgow area and over 20,000 (20,843) of our Facebook audience have their location set in Glasgow, individual East Dunbartonshire towns and surrounding areas. As East Dunbartonshire is not an official location on Facebook, is it likely that the majority of ‘Glasgow’ followers are residents and/or employees.
Facebook audience location breakdown:
- Glasgow - 6,030
- Kirkintilloch - 5,128
- Bishopbriggs - 2,951
- Bearsden - 2,586
- Lennoxtown - 1,305
- Milngavie - 1,122
- Kilsyth - 554
- Cumbernauld - 453
- Clydebank - 393
- Chryston - 321
On Facebook and Instagram, we have more women (Facebook; 73.1%, Instagram; 72%) following us than men (Facebook; 26.9%, Instagram 28%). The breakdown is more evenly split on YouTube with 57.1% male and 42.9% female. For the followers who have included their date of birth in their settings we can see the majority are of a homeowning/tenant age.
Age and Percentage of followers
| Age group | Percentage of followers % |
|---|---|
|
18-24 |
2 |
|
25-34 |
15.3 |
|
35-44 |
32.7 |
|
45-54 |
25.8 |
|
55-64 |
14.4 |
|
65+ women |
9.2 |
Combatting toxicity
As social media has evolved, toxicity and misinformation have become more evident. To successfully manage a social media channel, it is crucial to establish clear boundaries on what is and what isn’t acceptable.
We do this in a number of ways:
- Social media house rules are available on our website with the link in our Facebook bio
- Close monitoring of comments and hiding comments that are offensive, inflammatory and/or negative mentions of employees by name
- Profanity filter activated that automatically hides comments containing swear words, offensive language, bigoted phrases and common spam phrases
- Our content plan aims to foster positive engagement. Our content is strategically planned to focus on highlighting positive stories that promote the Council’s work and values
- Company lockdown feature gives us the functionality to instantly pause all scheduled comms in times of crisis
- Disabling of comments can be used when we expect or receive multiple offensive or hateful comments.
Inbox and customer enquiries
Customer Services access our social media accounts in order to answer private messages by residents. This is an alternative way for residents to contact the Council and plays a key part in our Connect, Call, Come In strategy.
In 2023/24 there were over 12,000 inbound private messages received with the breakdown outlined below:
- Facebook: 9,486
- X: 2,463
- Instagram: 414
Exploration of other channels
The Communications & Engagement team continually review the Council’s use of social media and the channels our audience can be found. With ‘new’ social media channels such as Threads and Bluesky growing slowly in the UK, there is an increasing trend towards ‘broadcast’ tools such as WhatsApp Channels or newsletters.
WhatsApp Channels is fast becoming an established communication tool for the public sector used to update followers in real-time. Newsletters are less instant but allow residents to receive regular news and important messages straight to their inbox.
Both of these methods of communication are broadcast rather than engagement – meaning there is no comment functionality. Throughout 2025/26 the Communications & Engagement team will explore and investigate both tools.
Conclusion
A deeper dive into our social media channels establishes a confidence that the Council is reaching residents, local groups and stakeholders successfully online, and that each platform’s audience reacts and engages in different content. We will continue to look at how we best use each channel effectively and explore further communication methods to ensure our communities are being kept up-to-date and informed of the Council’s work.