Performance and Rank
![]()
|
Indicator Performance |
||||
|---|---|---|---|---|
|
|
21/22 |
21/22 |
22/23 |
22/23 |
|
|
Number |
Proportion |
Number |
Proportion |
|
Improved Performance |
47 |
52% |
45 |
56% |
|
Declined Performance |
40 |
44% |
35 |
42% |
|
No Change/ NA |
3 |
4% |
2 |
2% |
- The majority of LGBF indicators (58%) have Improved or sustained performance from the 2021/22 position as of Feb 2023 only 42% of indicators have declined in Performance
|
Indicator Rankings |
||||
|---|---|---|---|---|
|
|
21/22 |
21/22 |
22/23 |
22/23 |
|
|
Number |
Proportion |
Number |
Proportion |
|
Improved Rank |
33 |
37% |
38 |
47% |
|
Declined Rank |
44 |
49% |
28 |
35% |
|
No Change/ NA |
13 |
14% |
15 |
19% |
- Two thirds of LGBF indicators (66%) have Improved or sustained in rank position from the 2121/22 position as of Feb 2023 only 35% of indicators have declined in rank position, indicating that where performance is declining it is doing so at a lesser rate in East Dunbartonshire compared to the national average.
Performance by Quartile
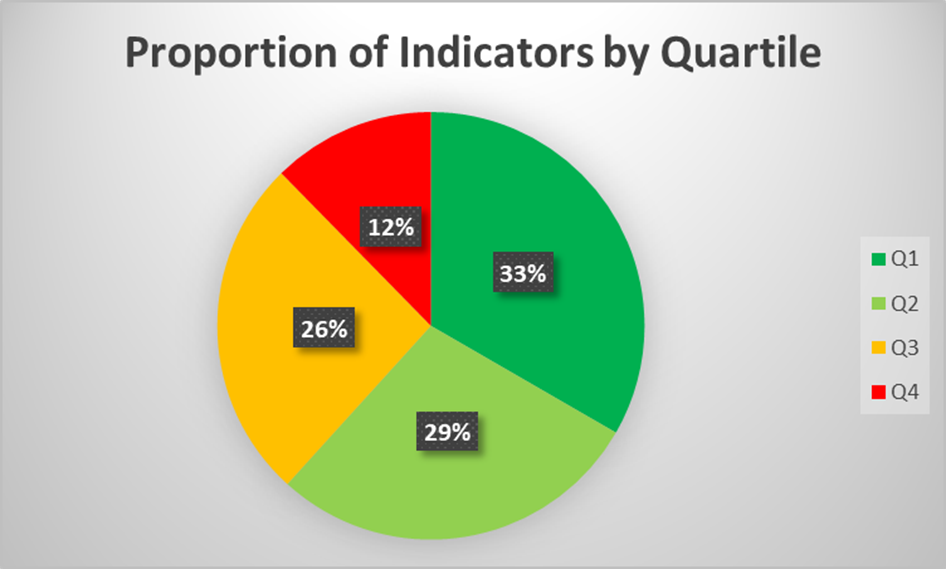
- East Dunbartonshire is currently reporting one third of indicators in the top quartile of Scottish Local Authorities and over 60% in the top half of Scottish Authorities, only 12% of indicators are reported in the bottom quartile and these have been listed below.
|
Proportion of PI’s in top and Bottom Quartiles |
||||
|---|---|---|---|---|
|
|
21/22 |
21/22 |
22/23 |
22/23 |
|
Quartile |
Number |
Proportion |
Number |
Proportion |
|
Top Quartile |
28 |
31% |
27 |
33% |
|
Bottom Quartile |
14 |
16% |
10 |
|
|
Bottom Quartile Indicators |
|---|
|
Cost per secondary school pupil |
|
Literacy Attainment Gap (P1,4,7 Combined) - percentage point gap between the least deprived and most deprived pupils |
|
Cost of roads per kilometre |
|
Net cost per waste collection per premise |
|
Net cost of waste disposal per premise |
|
% of adults satisfied with leisure facilities |
|
Average number of days taken to complete non-emergency repairs |
|
% of unemployed people assisted into work from council operated / funded employability programmes |
|
% of procurement spend spent on local enterprises |
|
Investment in Economic Development & Tourism per 1,000 Population |
Most Improvement/ Decline (By rank)
- The indicators listed below are the ones in the dataset that have seen a significant shift in rank placing (5 places or more), indicating that there has been substantial Improvement/decline in performance from the previous year
|
PI’s with significant improvement in rank (5+ places) |
|---|
|
Sickness absence days per teacher |
|
% of Crisis Grant Decisions within 1 day |
|
% of total household waste arising that is recycled |
|
Gross rent arrears (all tenants) as at 31 March each year as a percentage of rent due for the reporting year |
|
% of rent due in the year that was lost due to voids |
|
% of council dwellings meeting Scottish Housing Standards |
|
Average time per business and industry planning application (weeks) |
|
Town Vacancy Rates |
|
Immediately available employment land as a % of total land allocated for employment purposes in the local development plan |
|
Total useable reserves as a % of council annual budgeted revenue |
|
Uncommitted General Fund Balance as a % of council annual budgeted net revenue |
|
Ratio of Financing Costs to Net Revenue Stream - General Fund |
|
Actual outturn as a percentage of budgeted expenditure |
|
PI’s with significant decline in rank (5+ places) |
|---|
|
Literacy Attainment Gap (P1,4,7 Combined) - percentage point gap between the least deprived and most deprived pupils |
|
% of funded early years provision which is graded good/better |
|
Proportion of DHP Funding Spent |
|
Residential costs per week per resident for people aged 65 or over |
|
Street Cleanliness Score |
|
% of adults satisfied with libraries |
|
% of adults satisfied with leisure facilities |
|
Proportion of internal floor area of operational buildings in satisfactory condition |
Full list of Indicators and Rankings
Children’s Services
|
|
Improved |
Declined |
No Change |
|---|---|---|---|
|
Performance |
1 |
6 |
0 |
|
Rank |
3 |
3 |
1 |
|
Indicator |
21/22 Data |
22/23 Data |
21/22 Rank |
22/23 Rank |
Performance |
Rank |
|---|---|---|---|---|---|---|
|
Cost per primary school pupil |
£6649 |
£6712 |
13 |
13 |
|
|
|
Cost per secondary school pupil |
£9082 |
£9094 |
26 |
25 |
|
|
|
Cost per pre-school education place |
£10952 |
£11475 |
17 |
18 |
|
|
|
Overall average total tariff |
1364 |
1318 |
2 |
2 |
|
|
|
Average total tariff SIMD quintile 1 |
1048 |
1057 |
1 |
1 |
|
|
|
Average total tariff SIMD quintile 2
|
1038 |
1013 |
2 |
3 |
|
|
|
Average total tariff SIMD quintile 3
|
1158 |
1158 |
3 |
2 |
|
|
|
Average total tariff SIMD quintile 4
|
1432 |
1342 |
2 |
2 |
|
|
|
Average total tariff SIMD quintile 5
|
1553 |
1490 |
2 |
2 |
|
|
|
% of funded early years provision which is graded good/better
|
95.1% |
90.7% |
5 |
19 |
|
|
|
Participation rate for 16-19 year olds (per 100)
|
96.8% |
97.5% |
2 |
3 |
|
|
|
School Attendance Rate
|
94.3% |
93% |
5 |
1 |
|
|
|
% of adults satisfied with local schools |
79.7% |
83% |
9 |
5 |
|
|
|
% of P1, P4 and P7 pupils combined achieving expected CFE Level in Literacy
|
81.5% |
82.8% |
2 |
2 |
|
|
|
% of P1, P4 and P7 pupils combined achieving expected CFE Level in Numeracy |
86.1% |
87.3% |
2 |
2 |
|
|
|
Literacy Attainment Gap (P1,4,7 Combined) - percentage point gap between the least deprived and most deprived pupils |
25.7% |
29.5% |
21 |
27 |
|
|
|
Numeracy Attainment Gap (P1,4,7 Combined) - percentage point gap between the least deprived and most deprived pupils |
20.8% |
21.1% |
20 |
24 |
|
|


Adult Social Care
|
|
Improved |
Declined |
No Change |
|---|---|---|---|
|
Performance |
1 |
6 |
0 |
|
Rank |
3 |
3 |
1 |
|
Indicator |
21/22 Data |
22/23 Data |
21/22 Rank |
22/23 Rank |
Performance |
Rank |
|---|---|---|---|---|---|---|
|
Home care costs per hour for people aged 65 or over
|
£34.31 |
£35.06 |
21 |
20 |
|
|
|
Self Directed Support (Direct Payments + Managed Personalised Budgets) spend on adults 18+ as a % of total social work spend on adults 18+
|
6 |
5.6 |
16 |
18 |
|
|
|
% of people aged 65 and over with long-term care needs who receiving personal care at home
|
62.7 |
62.1 |
16 |
14 |
|
|
|
Residential costs per week per resident for people aged 65 or over
|
521.00 |
676.00 |
8 |
18 |
|
|
|
Rate of readmission to hospital within 28 days per 1,000 discharges
|
82.1 |
79.7 |
5 |
6 |
|
|
|
Proportion of care services graded 'good' (4) or better in Care Inspectorate inspections
|
86.2 |
87 |
5 |
1 |
|
|
|
Number of days people spend in hospital when they are ready to be discharged, per 1,000 population (75+) |
340 |
493 |
8 |
8 |
|
|
Corporate Services
|
|
Improved |
Declined |
No Change |
|---|---|---|---|
|
Performance |
8 |
6 |
0 |
|
Rank |
8 |
5 |
1 |
|
Indicator |
21/22 Data |
22/23 Data |
21/22 Rank |
22/23 Rank |
Performance |
Rank |
|---|---|---|---|---|---|---|
|
Support services as a % of total gross expenditure
|
3.8 |
3.4 |
14 |
12 |
|
|
|
% of the highest paid 5% employees who are women |
59.6 |
61.2 |
14 |
11 |
|
|
|
Gender Pay Gap
|
3.8 |
4.2 |
18 |
22 |
|
|
|
Cost Per Dwelling of Collecting Council Tax
|
£9.53 |
£8.43 |
26 |
23 |
|
|
|
Sickness Absence Days teacher
|
5.4 |
5.1 |
14 |
4 |
|
|
|
Sickness absence days per employee (non-teacher)
|
12 |
13.4 |
16 |
17 |
|
|
|
% of income due from council tax received by the end of the year
|
97.5 |
97.7 |
4 |
4 |
|
|
|
Payment of invoices % in 30 days
|
93.4 |
92 |
17 |
14 |
|
|
|
% of operational buildings that are suitable for their current use |
84.4 |
86 |
21 |
18 |
|
|
|
% of internal floor area of operational buildings in satisfactory condition
|
92.6 |
88.6 |
15 |
22 |
|
|
|
% of Crisis Grant Decisions within 1 day
|
97.8 |
99 |
11 |
6 |
|
|
|
% CCG Grant Decisions within 15 Days
|
96.3 |
96.8 |
13 |
12 |
|
|
|
Proportion of SWF Budget Spent |
122.7 |
139.1 |
12 |
13 |
|
|
|
Proportion of DHP Funding Spent |
92.1 |
87.3 |
13 |
18 |
|
|
Culture and Leisure
|
|
Improved |
Declined |
No Change |
|---|---|---|---|
|
Performance |
4 |
4 |
0 |
|
Rank |
3 |
4 |
1 |
|
Indicator |
21/22 Data |
22/23 Data |
21/22 Rank |
22/23 Rank |
Performance |
Rank |
|---|---|---|---|---|---|---|
|
Cost per attendance at sports facilities
|
4.77 |
2.98 |
9 |
8 |
|
|
|
Cost per library visit
|
3.34 |
2.63 |
14 |
13 |
|
|
|
Cost of museums per visit
|
7.09 |
4.47 |
16 |
18 |
|
|
|
Cost of parks & open spaces per 1,000 population
|
30143 |
30413 |
27 |
26 |
|
|
|
% of adults satisfied with librarie s |
84.3 |
77 |
5 |
11 |
|
|
|
% of adults satisfied with parks and open spaces
|
90 |
87.7 |
10 |
13 |
|
|
|
% of adults satisfied with museums and galleries
|
67.3 |
69.7 |
16 |
16 |
|
|
|
% of Adults Satisfied with Leisure Facilities |
79.3 |
74 |
4 |
11 |
|
|
Environmental Services
|
|
Improved |
Declined |
Same |
|---|---|---|---|
|
Performance |
10 |
5 |
0 |
|
Rank |
7 |
5 |
3 |
|
Indicator |
21/22 Data |
22/23 Data |
21/22 Rank |
22/23 Rank |
Performance |
Rank |
|---|---|---|---|---|---|---|
|
Net cost per waste collection per premise
|
£94.75 |
£96.16 |
29 |
30 |
|
|
|
Net cost of waste disposal per premise
|
£131.47 |
£120.19 |
26 |
26 |
|
|
|
Net cost of street cleaning per 1,000 population
|
£6,234 |
£6,318 |
2 |
2 |
|
|
|
Street Cleanliness Score
|
91.2 |
90.1 |
12 |
17 |
|
|
|
Cost of roads per kilometre
|
£14,685 |
£20,162 |
22 |
25 |
|
|
|
% of A class roads that should be considered for maintenance
|
28.3 |
27.2 |
20 |
20 |
|
|
|
% of B class roads that should be considered for maintenance
|
25.3 |
24 |
11 |
10 |
|
|
|
% of C class roads that should be considered for maintenance
|
28.9 |
28.7 |
13 |
16 |
|
|
|
% of unclassified roads that should be considered for maintenance
|
34.7 |
33.7 |
17 |
15 |
|
|
|
Cost of Trading Standards and environmental health per 1,000 population
|
£21834 |
£20395 |
15 |
14 |
|
|
|
Cost of Trading Standards, Money Advice & Citizen Advice per 1000 Population |
£8015 |
£7660 |
22 |
19 |
|
|
|
Cost of environmental health per 1,000 population
|
£13819 |
£12737 |
13 |
12 |
|
|
|
% of total household waste arising that is recycled
|
45.3 |
52 |
17 |
8 |
|
|
|
% of adults satisfied with refuse collection
|
89.3 |
91 |
4 |
3 |
|
|
|
% of adults satisfied with street cleaning
|
67.7 |
65 |
7 |
10 |
|
|
Housing
|
|
Improved |
Declined |
No Change |
|---|---|---|---|
|
Performance |
4 |
0 |
0 |
|
Rank |
3 |
0 |
1 |
|
Indicator |
21/22 Data |
22/23 Data |
21/22 Rank |
22/23 Rank |
Performance |
Rank |
|---|---|---|---|---|---|---|
|
Gross rent arrears (all tenants) as at 31 March each year as a percentage of rent due for the reporting year |
12.8 |
11.4 |
24 |
19 |
|
|
|
% of rent due in the year that was lost due to voids
|
1.4 |
1 |
14 |
8 |
|
|
|
% of council dwellings meeting Scottish Housing Standards
|
13.9 |
53.5 |
25 |
19 |
|
|
|
Average number of days taken to complete non-emergency repairs |
12 |
11.6 |
20 |
20 |
|
|
Economic Development
|
|
Improved |
Declined |
No Change |
|---|---|---|---|
|
Performance |
7 |
3 |
1 |
|
Rank |
6 |
4 |
1 |
|
Indicator |
21/22 Data |
22/23 Data |
21/22 Rank |
22/23 Rank |
Performance |
Rank |
|---|---|---|---|---|---|---|
|
% of unemployed people assisted into work from council operated / funded employability programmes |
8 |
7.8 |
27 |
29 |
|
|
|
Cost of planning & building standards per planning application
|
£3320 |
£4348 |
5 |
7 |
|
|
|
Average time per business and industry planning application (weeks)
|
11.1 |
7.4 |
14 |
4 |
|
|
|
% of procurement spend spent on local enterprises
|
12.2 |
12.2 |
32 |
31 |
|
|
|
No of business gateway start-ups per 10,000 population
|
12.3 |
11.3 |
22 |
23 |
|
|
|
Investment in Economic Development & Tourism per 1,000 Population
|
45390 |
59651 |
31 |
27 |
|
|
|
Proportion of properties receiving superfast broadband |
97.40% |
98.1% |
10 |
11 |
|
|
|
Town Vacancy Rates
|
7.2 |
5 |
8 |
3 |
|
|
|
Immediately available employment land as a % of total land allocated for employment purposes in the local development plan
|
24.9 |
32.7 |
19 |
11 |
|
|
|
Claimant Count as a % of Working Age Population |
3 |
2 |
4 |
4 |
|
|
|
Claimant Count as a % of 16-24 Population |
3.2 |
2.2 |
5 |
4 |
|
|
Financial Sustainability
|
|
Improved |
Declined |
No Change |
|---|---|---|---|
|
Performance |
5 |
0 |
0 |
|
Rank |
4 |
0 |
1 |
|
Indicator |
21/22 Data |
22/23 Data |
21/22 Rank |
22/23 Rank |
Performance |
Rank |
|---|---|---|---|---|---|---|
|
Total Useable Reserves as a % of council annual budgeted revenue
|
15.7 |
20.2 |
28 |
23 |
|
|
|
Uncommitted General Fund Balance as a % of council annual budgeted net revenue
|
1.9 |
2.2 |
27 |
18 |
|
|
|
Ratio of Financing Costs to Net Revenue Stream- General Fund
|
7.4 |
5.9 |
24 |
15 |
|
|
|
Ratio of Financing Costs to Net Revenue Stream- HRA
|
21 |
21.3 |
13 |
13 |
|
|
|
Actual outturn as a percentage of budgeted expenditure
|
95.7 |
104 |
23 |
1 |
|
|